Reflecting on the purposes of education, Heather McGhee and Victor Ray, authors who focus on how citizens can connect across differing backgrounds and opinions, recently wrote in The New York Times (2022) that schools play a critical role in preparing citizens for democracy. They argue that to build a true democracy, young people must gain an unvarnished understanding of persistent social challenges—and the tools to confront them. We couldn't agree more, and we believe critical data literacy comprises one set of tools that individuals must acquire to work toward social justice within a healthy democracy.
What Is "Critical Data Literacy"?
Today, our world is inundated with data—on topics ranging from inflation to patterns of extreme weather, to the spread of viral diseases, to what students are learning (or not) in school. It's left up to individuals to make sense of what's fact or fiction and how to act in response. Unfortunately, up to 80 percent of individuals responding to business and public surveys express little confidence in their abilities to understand and work with data (Qlik, 2018).
In our view, data literacy involves the ability to read and write with data —to extract meaning from diverse types of data and communicate what those data reveal, particularly in numeric, statistical, and graphical forms. Drawing on the work of Gutstein (2006), we consider "critical data literacy" to involve the ability to read and write the world with data. Critical data literacy builds on data literacy and incorporates ethical, social, and political perspectives. People who practice critical data literacy routinely consider data ethics and how data can be used or misused. Just as important, they examine data to understand power relations in society. Recognizing and working to remedy the inequitable access various groups have to social, economic, and political resources is a hallmark of social justice, after all.

Schools have a big role to play in helping students to develop critical data literacy and to become informed citizens and create a more just world.
Schools have a big role to play in helping students to develop critical data literacy and to become informed citizens and create a more just world. As a team of researchers, statistics educators, and curriculum developers, we've worked to infuse skills for critical data literacy into schools. In 2018, we launched a project funded by the National Science Foundation titled "Strengthening Data Literacy across the Curriculum" (or SDLC) to create a set of curriculum materials to support high schools in promoting students' critical data literacy. Collaborating with more than a dozen high school mathematics and social studies teachers in Massachusetts, our team tested and refined these materials in schools with high proportions of students from Black, Latinx, and low-income communities. We ultimately produced two curriculum modules, "Investigating Income Inequality in the U.S." and "Investigating Immigration to the U.S.," which have been implemented in high school non-Advanced Placement mathematics classes and in a small number of U.S. history classes. Each module (available free) takes approximately 15 hours of instructional time to complete in full. In our study, teachers used our materials successfully after approximately 10 hours of professional development prior to implementing each module.
Our modules are built on three key components:
1. They center on topics and questions that engage students with social justice issues —issues we've found to be compelling and culturally relevant for the students involved. In the module about income inequality, for example, students examine large-scale data from the U.S. decennial census and the American Community Survey (ACS), which is collected annually by the U.S. Census Bureau to address questions such as: What is income inequality? How have higher- and lower-income earners been faring over time? How much income inequality exists between males and females, and does education help to explain the gender wage gap? In the module exploring immigration data, students encounter common myths or claims about immigrants in the U.S. Students (Denhart, 2017; Learning for Justice Staff, 2017) and use census and ACS data to investigate questions like: Are there more immigrants in the U.S. than ever before? or Are immigrants less likely than U.S.-born individuals to participate in the labor force?
2. They include standards-based interdisciplinary content. Curriculum activities focus on content aligned with multiple sets of high school learning standards. For example, students are asked to conduct data analyses that strengthen their conceptual understandings of measures of center and variability, sampling variability and margins of error, comparing quantitative distributions, and using conditional proportions to compare categorical data—central statistical ideas within the Common Core State Standards for Mathematics for secondary grades.
Students also learn to anchor data work using a four-step data investigative process that's fundamental to data literacy: (1) formulating questions; (2) assembling data; (3) using statistical and other tools to analyze data; and (4) interpreting results (Bargagliotti et al., 2020). This process echoes the four-step Inquiry Arc that leaders in social studies education say should undergird students' social studies and civics learning (National Council for the Social Studies, 2013). Investigations of U.S. income inequality and immigration also align with recommended U.S. history frameworks nationally (National Center for History in the Schools, 1996) and with Massachusetts state frameworks for teaching history.
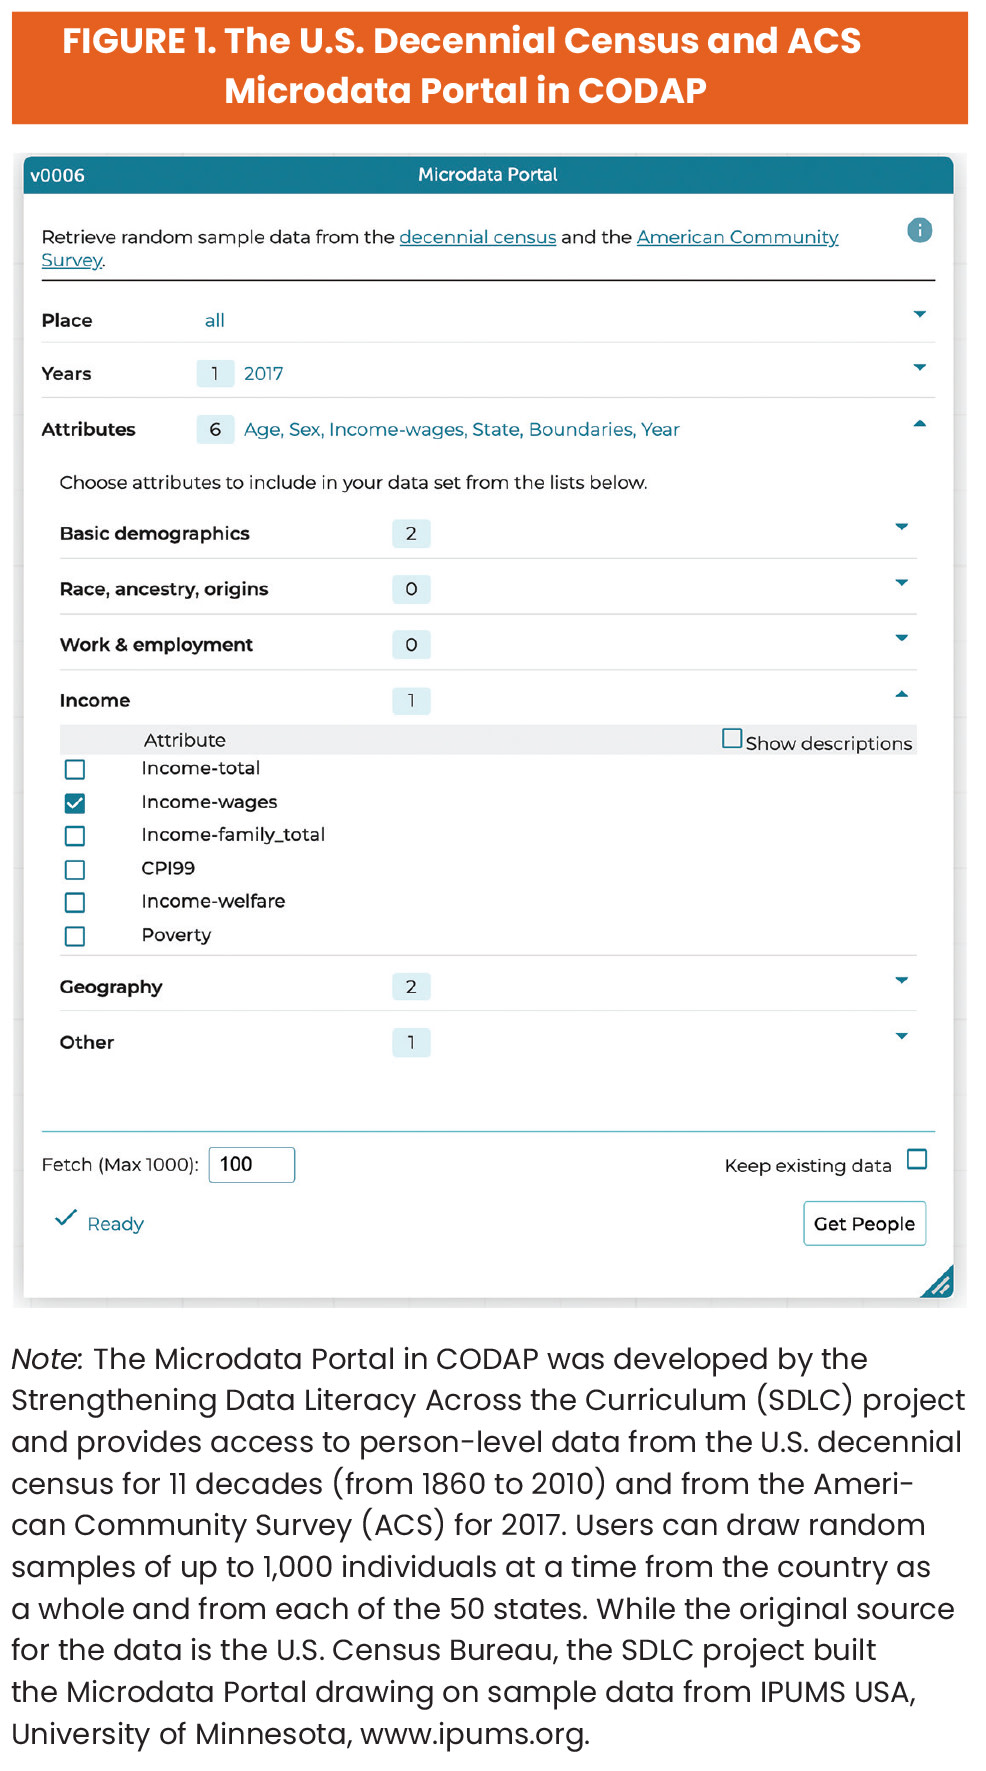
3. They follow research-based learning approaches. Following recommendations from statistics education research, our modules require students to learn to analyze large-scale datasets with accessible digital tools (Chance et al., 2007). In lessons in our modules, students used the Common Online Data Analysis Platform, or CODAP. This free, web-based data analysis and visualization tool helps students develop a conceptual understanding of statistical ideas rather than focus on calculations. We built a Microdata Portal (a free plug-in within CODAP) that provides access to anonymized person-level data from multiple decades of the decennial census and the 2017 American Community Survey (see Figure 1).

Using interactive tables and graphs, students assemble, manipulate, and analyze datasets containing information on thousands of individuals. They work in pairs or in small groups, and teachers support student thinking by facilitating group discussions and providing feedback. Each module's investigations also have a project-based orientation, providing scaffolding and a culminating investigation in which students explore one of the module's driving questions, using variables of their choice.
Data Literacy in Action
From spring 2019 through spring 2021, 15 high school mathematics teachers in 12 schools implemented iterations of these two modules in mathematics classrooms, and during the peak of the COVID-19 pandemic in fall 2020, several mathematics teachers taught the immigration module remotely. All these schools were located primarily in the metropolitan Boston region. To get a sense of how these curriculum elements strengthen students' critical data literacy, let's look at some specific learning activities involved.
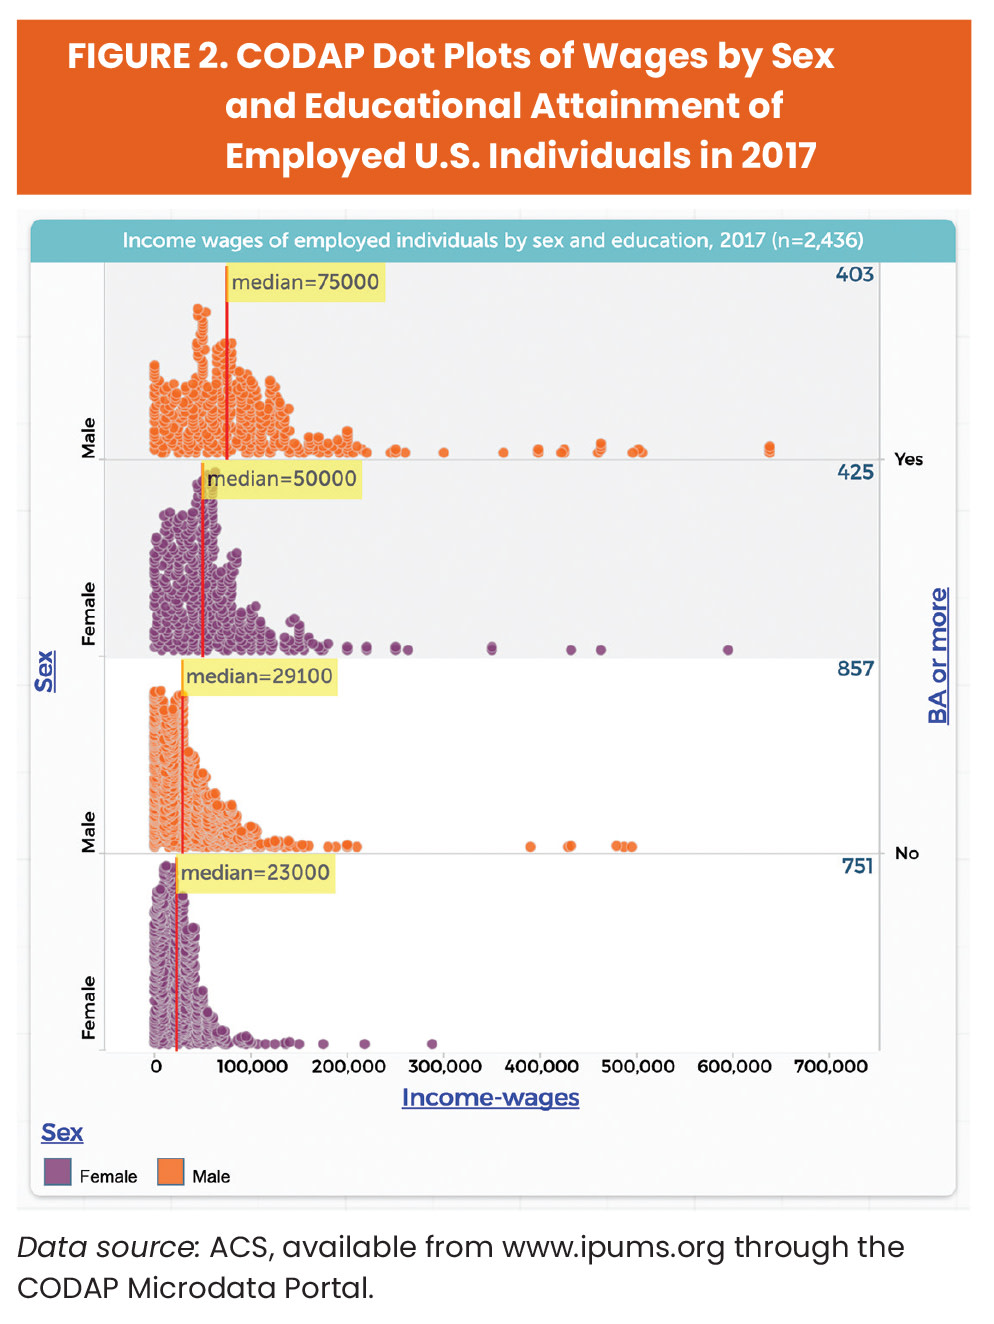
Generally, students begin each module by examining the census and ACS questionnaires and discussing the strengths and limitations of different data sources. To investigate how income inequality in the U.S. has changed over time, for instance, a lesson has students create and interpret graphs of wages reported by employed individuals in 1940, 1980, and 2017, displayed in constant 2017 dollars. Students can examine visual displays of wage distributions that draw from these data, including mean and median values and statistical outliers, to see how the wages of higher- and lower-income earners have diverged over time. These graphs also shed light on the degree to which wages in the United States differ for males and females and whether the wage gap can be explained by education levels (Figure 2 shows this data visualization). In the module's final investigation, students discover that even after controlling for other variables of their own choosing (such as occupation, marital status, and hours worked), the wage gap between male and female workers persists—which prompts discussion of possible gender discrimination in wages.

Students analyze data similarly to examine common claims about immigrants in the U.S. In one lesson, students create CODAP graphs using data from the census and ACS to investigate a claim that immigrants are less likely than U.S.-born individuals to be employed. Looking at 2017 ACS data, they discover that, contrary to this claim, overall rates of labor force participation were higher for immigrants that year than for people born in the U.S. Further investigations with additional variables continue to show the weakness of the original claim while revealing more complex patterns. For instance, for people without a bachelor's degree, employment rates among immigrants (63 percent) are higher than among U.S.-born people (55 percent), while for those with a bachelor's degree, employment rates among immigrants (73 percent) and those U.S. born (72 percent) are similar.
Students' statistics and data literacy outcomes—what we call their abilities to read and write with data—grew significantly.
We saw good results in these classes in terms of stronger understanding of core data concepts and interpreting data related to social issues. In classrooms that used the income inequality module in fall of 2019, students' statistics and data literacy outcomes—what we call their abilities to read and write with data—grew significantly based on pre- and post-module assessments that we adapted from validated instruments. Specifically, we saw significant growth in students' abilities to make sense of different data representations, reason about measures of center, and engage in multivariable thinking (Louie et al., 2022). Students' interests in data analysis also grew significantly, based on established pre- and post-module interest scales. Even when schools went remote due to the pandemic, students who learned through the immigration module showed significantly higher levels of interest in data and a stronger perception of the importance of working with data.
The modules also appeared to increase students' awareness of social justice issues. They strengthened students' ability to read and write the world with data. After completing the modules, some students expressed greater awareness and deeper understanding of specific social and political conditions in the world. One student wrote in a survey, "I enjoyed the lessons that discussed current issues such as income inequality between men and women and people with different levels of education. It connected the lesson with the real world and helped me understand both statistics and society in more in-depth ways." Another shared:
Our generation has a lack of understanding of real-world issues, and I feel like we're pretty influenced by each other and our parents. You can't really talk politics in school, but this is the closest you can probably get, where the kids can form their own opinion. I bet you a lot of kids' opinions about this topic changed. . . . I and a few other students were on a certain side or leaning towards one end of the issue, but in the end [the data showed what we originally assumed] was not the case.
And the following comment indicated that some teens felt empowered to work with data, potentially for social good:
You always hear about it, like there's income inequality between different genders, and when we actually did the data, it was like—oh wow, this is real. People aren't just making things up. This is a real problem—and hopefully we can figure something out.
Helping Teachers Tackle Such Lessons
We've found teachers can get students working successfully with data—if they have help. To prepare teachers to try data-focused materials in their classes, our team provided 10 hours of professional development for each module. We shared an overview of module content and, casting teachers as learners, modeled how to teach the lessons and support students in data-analyzing activities and projects. Through guiding teachers in using these materials, we've realized many teachers need additional learning or practice in five domains to successfully support students' critical data literacy.
1. Data concepts. We worked with both high school mathematics and social studies teachers to develop our materials, but focused module testing in mathematics classrooms. Consistent with prior research (Franklin et al., 2015), our collaborating math teachers were experienced in teaching mathematics, but less so in teaching data concepts and practices. We've found that, in general, teachers need professional learning opportunities where they can apply core statistics and data concepts to real-world data before they will feel comfortable facilitating these activities among students.
2. Datasets and sources. Almost none of our collaborating teachers had worked with large-scale datasets previously. To ensure that teachers feel comfortable with the datasets they introduce to students, teachers need opportunities to become familiar with the origins, structures, strengths, and limitations of these datasets. During our PD sessions, teachers had chances to explore decennial census and ACS data from the Microdata Portal themselves, practice "cleaning" messy data, and discuss how different variables were defined and coded. Several organizations within the Data Science for Everyone coalition offer teachers professional development and materials to teach with real-world datasets.
3. Data analysis tools. Although our collaborating teachers had experience using spreadsheets, working with data visualization and analysis tools was new. The CODAP platform has an intuitive interface and is easy for students in secondary grades to learn, but teachers need time to play with tools like CODAP before they will feel confident in introducing these tools to students.
4. Background on social issues. Teachers don't need to be experts in social justice topics that data lessons focus on. But students' data investigations will benefit if teachers have a basic understanding of these issues—and key concepts or debates connected to them—and can point students to reputable information sources to compare and reflect on their data findings. Many organizations study topics like income inequality and immigration and make their findings widely available; teachers should seek out such information.
5. Ways to facilitate challenging conversations. To promote critical data literacy, teachers should know how to guide students through conversations on why different groups in society may experience unequal social, economic, or political outcomes. These conversations can be difficult, particularly when issues such as racism, sexism, and other forms of group discrimination arise. Teachers need guidance on how to facilitate such discussions to avoid hurt or harm among participants. Helpful resources can be found (among many places) at the websites of Learning for Justice and the Anti-Defamation League.
Tackling Data Head-On
Democratic populations need critical data literacy to make sense of the data flooding our everyday lives and to understand and confront systemic social challenges. Schools should be at the forefront of fostering critical data literacy. Teachers need not only curriculum materials, but also support for giving students the understanding and skills to "read" data in various disciplines—including chances to collaborate with colleagues across departments. Our experiences reveal that teachers and school leaders want to provide such learning opportunities for students, and our research suggests such efforts may be well received and impactful. In the words of one student, "I think we need to do more of [these modules] in school, to be honest with you. A lot of people are afraid to talk about [these] issues. … If more kids tackle it head-on, they'll have a better understanding of how our world really works."
Note: This work was supported by the National Science Foundation (NSF) under Grant No. DRL 1813956. Opinions, findings, conclusions, or recommendations are those of the authors and do not necessarily reflect the views of the NSF.
Reflect & Discuss
➛ Do you agree that "critical data literacy" is an essential skill young people need to be able to work toward social justice? Why or why not?
➛ How might you begin incorporating critical data literacy into your curriculum? What steps could you take?