

Just one more thing to do!" That's how teachers often react to school mandates to use data to inform their teaching. But it doesn't have to be that way. Here are two stories of educators who took common-sense steps to use data—and discovered how helpful data analysis can be.
Charlie's Approach
During a high school English department meeting, the department chair requested that teachers start using more data to inform their teaching. It was not a well-thought-out initiative; and besides, the teachers had just been subjected to several workshops on how to write and use SMART goals. It was really too soon for yet another "improvement" task. Most teachers chose to just wait and see. But Charlie, a 10th grade English teacher, decided to have a go.
The Instructional Move
Charlie wondered whether data could help him involve more of his students in class discussions about poetry. In particular, he was concerned about his three classes of 10th graders, each with about 22 students. For most of these kids, reading was not a priority.
Usually, Charlie presented poems by reading them to the class, pointing out some features, and asking the students to respond. He usually got a handful of desultory or superficial comments. (It's true that one time he was surprised when a boy, on hearing "Stopping by Woods on a Snowy Evening," said that he too had once stood alone on a cold, snowy night and wondered whether living was worth it. But the student didn't elaborate on the insight.)
Charlie speculated that the students didn't generally comment for two reasons. First, it's hard to make sense of a poem when you lack confidence in your literacy skills. Second, it's risky to say something when you're afraid you don't know what you're talking about. The trick, then, was to reduce the risk. Perhaps more students would comment if they could write their thoughts first rather than say them out loud right away.
Charlie decided that after he read a poem, he would distribute index cards and have students write something about it. He would offer several prompts to get them going, such as, "The first thing that came to mind when I heard the poem was …," "I heard this word in the poem and I [like it, don't know what it means, thought it was weird, thought it was beautiful] …," and "This poem reminds me of another poem we heard because …."
After the students had all written something, Charlie would ask a student to read his or her card, pass it to a classmate to read, or give it to him to read. Depending on the comment, Charlie would follow up by asking another student to respond, by laughing, by glaring over his glasses, or by doing whatever else seemed appropriate. At the end, he would ask the students to sign the cards and then collect them.
SMART and Simple
Charlie realized that his idea fit into the SMART-goal format that teachers were supposed to practice. His overall goal was "Use student in-class comments as one means to increase student engagement in literature." Here's how he wrote up his SMART criteria:
- Specific and strategic: There will be a significant increase in the number of students who respond out loud in class to poetry as a result of the "write first, talk second" strategy.
- Measurable: Students who respond can be counted.
- Action-oriented: Index cards will be handed out and collected.
- Rigorous, realistic, and results-focused: Currently 5–6 kids respond in each class. This will increase to 10–12 kids per class, a 100 percent improvement.
- Timed and tracked: Participation should improve within 2–3 lessons, certainly by the end of the 10-lesson unit, and remain at the higher level.
Charlie was sure that he'd know whether his new approach was working without actually resorting to counting comments and recording them. But he was willing to collect the data to play along with the English department's latest initiative. Besides, if he had a chart with numbers to show his colleagues, they would "ooh" and "ah" and remind him that language arts teachers are supposed to be math phobes. That would be fun, he mused.
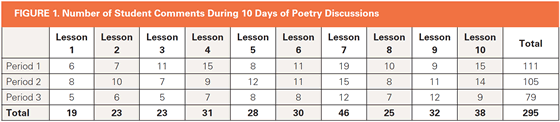
And it would be easy—all he had to do was write down the number of comments kids made in each of his three 10th grade poetry classes each day. By the end of the 10-day poetry unit, he had a chart with 30 numbers (see fig. 1).
Figure 1. Number of Student Comments During 10 Days of Poetry Discussions

Where the Numbers Led
Charlie was pleased with his chart. It plainly showed that the number of comments from students had increased in all of his classes. Better yet, in most cases the comments had increased far beyond what he had hoped. He had objective evidence that his intervention had made a big difference. "Ha!" thought Charlie, "I met and exceeded my goal. Who's in charge of bonuses around here?"
But Charlie could also see patterns in the data that he'd noticed in a qualitative way and that now were supported by the numbers. For example, Lesson 7 dealt with a contemporary poem about teens and their parents. He was not surprised that it would elicit lots of commentary, but the data showed it loud and clear. And there were other trends, such as the overall increase in student comments as the unit proceeded. If student in-class comments were any indication of engagement, and if engagement was any indication of learning, here was clear evidence that the kids were starting to get it.
And of course, he saw something he already knew—his 3rd period class was weaker than the other two. The data helped, though, in indicating just how much weaker.
At this point, Charlie's professional curiosity kicked in. He wondered what else he could do to get the students more involved. He wondered what he might do to get the 3rd period class more in line with the others; what he might do to get a poem with more traditional subject matter to elicit the same level of response as the poem about the teens and parents; what he might do to get a perfect score (a comment from every student in the class); and on and on. Charlie began to realize that the patterns the data revealed were not the endpoint, but the starting point of thinking about what he might try next—and how he could document all these new moves. "This is rather fun," he thought, "once you see how it works."
Alice, Brad, Christine, and Derek: A Team's Approach
The science department in a small high school included Alice, Brad, Christine, and Derek. Alice taught 11th and 12th grade physics and chemistry. Brad taught 10th grade biology, some 11th grade chemistry, and some 9th grade general science. Christine covered 10th grade biology and 11th grade chemistry. Derek had the majority of 9th grade general science as well as a senior elective in earth science. All four were content experts, and among them they had 60 years of teaching experience. They all loved their work.
The school required students to take three years of science, and the students had fared respectably on the statewide graduation exam. Having gotten this high-stakes challenge under control, Alice, Brad, Christine, and Derek were ready to try something new, and they decided to try it as a team.
The Instructional Move
The four teachers had their eye on 21st century skills, mostly because Alice had done some consulting gigs with a chemical company while in graduate school, and Christine had worked for a biotech firm before becoming a teacher. In addition, the department was considering getting its students involved in the International Science and Engineering Fair.
The team thought that a focus on individual student presentation skills might address both of these needs. They decided to implement a departmentwide requirement that students make brief but high-quality presentations explaining science content to their classmates.
The team developed the following SMART goal: "Develop 21st century skills among the science students. Require science students to practice and demonstrate presentation skills. Create a baseline for longitudinal comparisons." Here were their criteria:
- Specific and strategic: Once per quarter, in each classroom, require each student to give a four-minute science presentation. Score the presentations with a rubric.
- Measurable: The rubric has eight criteria and four performance levels.
- Action-oriented: All students in the class must make the presentation.
- Rigorous, realistic, and results-focused: Students must present some piece of the science curriculum or a related area of scientific interest to their classmates. The presentations must be of high quality.
- Timed and tracked: Each student will present once per quarter. Results will be tabulated at the end of each quarter. These numbers will serve as a baseline for future comparison.
Tracking the Results
The team decided to use an established high school science presentation rubric with performance levels from 1 to 4 and with eight criteria (organization, content knowledge, visuals, mechanics, volume, vocabulary, demeanor, and pacing) to guide the scoring. With 320 science students in the school, the team decided to start with a manageable number. They selected two 11th grade chemistry classes; they figured that 11th graders were more socially mature than underclassmen but still adaptive enough to take the new presentation requirement seriously. Also, this grade level was taught by the two teachers who had the most experience with professional presentations, Alice and Christine.
They would collect data for two terms to see how it went. With a rubric composed of eight criteria, that meant that each student would have eight scores in Term A and eight scores in Term B.
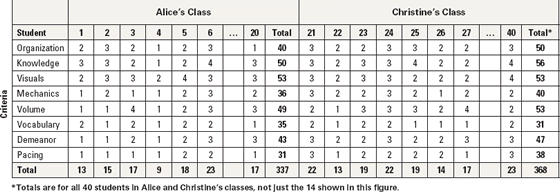
Figure 2 shows a portion of the data from the first term, with the rubric criteria on the left, 14 of the 40 students across the top—7 in Alice's class and 7 in Christine's—and the performance-level scores for each student in each of the boxes. (Total scores for each student appear at the bottom of each column, and totals for each criterion appear at the far end of each row.)
Figure 2. Selection of First-Term Student Scores on Science Presentations

Where the Numbers Led
The results of the first term sparked a lively discussion among the four science teachers. Everyone quickly noted that students in Christine's class earned more points than those in Alice's class. They kidded Alice about being true to form (she was famous for her tightfistedness with As). Everyone agreed that maybe they needed to have more conversations about consistent application of the rubric.
More interesting, though, were the totals for each of the criteria. In both classes, pacing scored the lowest or second lowest—probably not too surprising, because pacing is difficult and the students had no experience with this new presentation requirement. Vocabulary trouble, too, wasn't hard to fathom; everyone knows chemistry terms can trip you up. The fact that visuals received a high score was also expected: Kids love pictures and can be creative at finding them. The relatively strong showing on content knowledge pleased everyone, although they all agreed that even this area had room for improvement.
As the teachers continued to examine the data, they found themselves thinking about what they might do in the second term. Clearly, they needed to directly address all the criteria, and especially pacing and vocabulary skills. The question was, how?
As their discussions continued, the teachers decided that students would benefit from modeling. Alice and Christine chose two students to present their talks to their classmates again as a way for everyone to examine expectations. They selected presentations that were good, but not the very best, offering the other students a challenge but not an unachievable goal. They also decided to videotape each of the students' presentations during the second term. Students used these videos to review their work independently, and all four teachers used them to demonstrate and discuss student presentation skills in the other science classes.
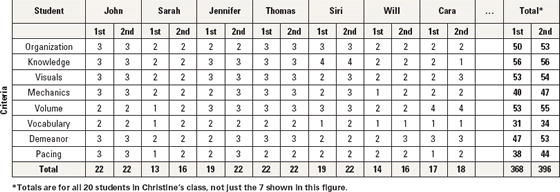
Alice, Brad, Christine, and Derek could see that they were entering into a powerful feedback loop, and they were keen to see what the students would do with it. After the second term, the teachers created a chart that aligned each student's scores for the first and second terms, making it easy to see changes for each student on each of the eight criteria. (Figure 3 shows a section of this chart containing data for seven students in Christine's class.) They noticed that student scores had risen overall (from 368 to 396 in Christine's class and from 337 to 376 in Alice's class) and that the gain in Alice's class was higher than that in Christine's. They also noticed strong gains in the areas where students had struggled the most in the first term—pacing, demeanor, vocabulary, and mechanics.
Figure 3. Section of Chart Comparing First-Term and Second-Term Scores on Science Presentations
Gathering More Information
Once again, the teachers were fascinated with the results. Talking with students, they learned that most still found the presentations stressful, but they could see what they had to do to get better. The students all agreed, too, that the examples of their classmates' presentations combined with the teachers' positive and corrective remarks really helped. As one boy said, "When you want us to do something right, it works better to show us than to tell us." The kids also said that it was fun, or at least interesting, to see their classmates making presentations.
There were pleasant surprises, like students who were quiet in class but created great visuals and looked right at everyone the whole time while talking. Other students said that one or another presentation helped them understand a chemistry idea for the first time. Many of them liked the idea that they had to dress a little better on presentation day, although all were glad to get back to their "regular" clothes. Of course, all the teachers noticed that the presentations took up a lot of class time, which could be a serious problem when they expanded the requirement to the 9th and 10th grades, where there is a statewide graduation exam.
Nevertheless, although Alice and Christine couldn't put their finger on it, somehow the presentations had brought more intellectual life to their classrooms. There seemed to be a slight change in ownership among the students. Both teachers felt that having the students do the teaching, even for a few minutes, was a welcome change. They also genuinely enjoyed watching the kids learning an important life skill.
Especially nice was the visit from the principal, who stopped by to tell Christine that he had heard from an 11th grade dad that the "presentation thing" in his daughter's chemistry class was great. The father was a businessman and knew about the importance of clear stand-up presentations. His daughter had spent quite a bit of time on the assignment and even asked her parents to hear her practice it. "Fantastic," he said, "keep up the good work."
The science teachers presented their findings at the next schoolwide faculty meeting. They talked about the value of the data, even when it merely reinforced their subjective impressions; the power of the student models; the challenge and usefulness of a rubric to generate data; and the confidence they felt in their departmentwide commitment to a learning goal, its successful execution, and its quantified documentation. Although many questions remained, they clearly knew what steps to take next.
Taking Charge of Data
With all the mandates imposed on education today, teachers often feel besieged by expectations that they will set goals, monitor progress, and be held accountable for results. These two stories show that it's possible for teachers to take top-down mandates and apply them to authentic needs. By taking small, common-sense steps, educators can make data work for themselves and their students.