
Standards-based grading and reporting have been topics of discussion for years, primarily because of the current system's shortcomings (Brookhart & Nitko, 2008; Guskey & Bailey, 2001; Reeves, 2011). In the traditional system, students acquire points for various activities, assignments, and behaviors, which accrue throughout a grading period. The teacher adds up the points and assigns a letter grade.
A variation on this theme is to keep track of percentage scores across various categories of performance and behavior and then translate the average percentage score into a letter grade or simply report the average percentage score (for example, 62.9 percent).
These practices provide little useful information about a specific student. A student might have received an overall or "omnibus" letter grade of B, not because he had a solid grasp of the target content, but because he was exceptionally well behaved in class, participated in all discussions, and turned in all assignments on time. Likewise, a student may have received a percentage score of 62.9, not because she displayed significant gaps in understanding regarding the target content, but because she received a zero for tardiness on assignments or for disruptive behavior. In addition to this lack of specificity, one teacher's criteria for assigning a letter grade of A, for example, might be equivalent to another teacher's criteria for assigning a letter grade of B, or even lower.
In an effort to cure the ills of current grading and reporting systems, many schools and districts across the United States have attempted to implement a standards-based system. We have four recommendations regarding best practices in this area (Marzano, 2000, 2006, 2010).
Recommendation 1: Get rid of the omnibus grade.
An effective standards-based grading and reporting system should eliminate the overall or "omnibus" grade. In its place, teachers should score specific measurement topics. Figure 1 (p. 36) depicts how this might look in mathematics for one middle school student for the first-quarter grading period.

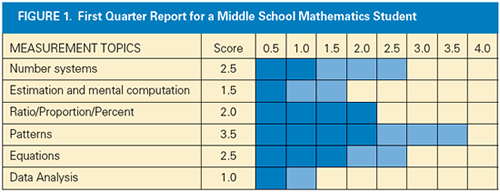
Notice that this graph has six bars, each of which depicts the student's summative score at the end of the grading period. The dark section of each bar represents the student's status at the beginning of the grading period. In the measurement topic "number systems," for example, the student started with a score of 1.0. The lighter section of the bar represents the student's knowledge gain at the end of the grading period. That same student ended the grading period with a score of 2.5—a gain of 1.5 points. Covington (1992) has proposed that demonstrating knowledge gain can be intrinsically motivating to students because people typically are encouraged when they see they have increased their understanding and skill.
The scale used in Figure 1 is a 0 through 4.0 metric. This is preferable to the 100-point scale because the latter, used in isolation, is not very amenable to tracking student progress. It tells teachers little about the content measured or the difficulty level of that content.
But Who Knows What?
To illustrate one drawback of the 100-point system, assume that a teacher designs a test worth 100 points that covers two of the topics reported in Figure 1—patterns and data analysis. Let's assume that 35 of the 100 points deal with patterns and 65 of the 100 points address data analysis.
Now consider two students, both of whom have attained a score of 70. The first student might have acquired all 35 of the 35 points on patterns but only 35 of the 65 points on data analysis. The student has demonstrated a robust understanding of patterns but only a partial understanding of data analysis. The second student might have received only 5 of the 35 points on patterns but all 65 points on data analysis. This student has demonstrated an opposite pattern. The convention of designing tests that involve more than one topic and then scoring these tests using the 100-point (or percentage) scale makes it impossible to gauge individual students' knowledge.
How Complex Is the Content?
Even if a teacher were vigilant enough to design tests that addressed a single topic, the tests still might not be useful in tracking student progress. If the first test addressed simpler content relative to a topic, students would generally receive high scores. However, if the second test addressed more complex content, students might receive lower scores even though they had learned quite a bit about the topic. What we need is a device to determine the level of a test's complexity. Once we do this, we can use the 100-point scale with some integrity in terms of tracking students' progress.
To make classroom assessments more comparable, we can use proficiency scales that delineate both the topic and the level of complexity being measured. Consider the left-hand side of Figure 2 (p. 38), which contains a generic form of the scale; this quantifies student understanding along a continuum that goes from lack of understanding of even the most basic concepts to understanding complex content. The score of 3.0 contains the target instructional goal for a topic and is the fulcrum of the scale.
Figure 2. Generic and Specific Examples of a Proficiency Scale
Grades That Show What Students Know - table
Score | Generic Form of Proficiency Scales | Specific Example for Topic of Animal and Plant Survival |
|---|---|---|
| 4.0 | More complex content. | Students will be able to compare and contrast different ways in which plants and animals breathe and find nourishment (for example, comparing and contrasting the fact that plants use their roots and leaves to take in air and food, whereas animals use their lungs to breathe air and their digestive systems to obtain nourishment). |
| 3.5 | In addition to score 3.0 performance, partial success at score 4.0. | In addition to score 3.0 performance, partial success at score 4.0. |
| 3.0 | Target objective. | Students will be able to describe and give examples of what different plants and animals need to survive. |
| 2.5 | No major errors regarding score 2.0 content, and partial success at score 3.0 content. | No major errors regarding score 2.0 content, and partial success at score 3.0 content. |
| 2.0 | Simpler content. | Students will be able to recall specific terminology, such as plant, animal, survival. Students will be able to recall details about survival—for example, both plants and animals need food, air, and water to survive; plants absorb nutrients and air through their roots and leaves; animals use respiration (lungs) to breathe and digestion to process nutrients. |
| 1.5 | Partial success at score 2.0 content, but major errors or omissions regarding score 3.0 content. | Partial success at score 2.0 content, but major errors or omissions regarding score 3.0 content. |
| 1.0 | With help, partial success at score 2.0 content and score 3.0 content. | With help, partial success at score 2.0 content and score 3.0 content. |
| 0.5 | With help, partial success at score 2.0 content, but not at score 3.0 content. | With help, partial success at score 2.0 content, but not at score 3.0 content. |
| 0.0 | Even with help, no success. | Even with help, no success. |
From Designing and Teaching Learning Goals and Objectives (pp. 68–69), by R. J. Marzano, 2009, Bloomington, Indiana: Marzano Research Laboratory. Copyright 2009 by Marzano Research Laboratory. Adapted with permission.
Figure 2 shows that the instructional goal is for students to be able to describe and exemplify what different plants and animals need to survive. Score 2.0 involves simpler content: in this case, recalling specific terminology and factual information about plants and animals. Score 4.0 contains more complex content relative to the topic: in this case, comparing and contrasting animals and plants. The remaining scores in the scale all reference these three levels of content. That is, none of the other levels contains new content. A score of 3.5 indicates competence on score 2.0 and 3.0 content and partial success on score 4.0 content. A score of 2.5 indicates success on score 2.0 content and partial success on score 3.0 content, and so on.
In working with schools and districts, we've found that three levels of content make it easy for teachers to design assessments without sacrificing precision of measurement. More specifically, teachers can design assessments that address one level of proficiency only—for example, a test that covers only score 2.0 content—or they can design tests that cover all three levels of content. When a test addresses only one level of content, the 100-point scale makes some sense. If students demonstrate mastery on a test of 2.0 content, they have reached score 2.0 status on the proficiency scale. If a test addresses all levels of proficiency (that is, items involve 2.0 content, 3.0 content, and 4.0 content), then the teacher scores each of these three sections with an eye toward students' competency at that particular level of item difficulty. (For a more detailed discussion of scoring tests using proficiency scales, see Marzano, 2010.)
Recommendation 2: If you can't get rid of the omnibus grade, provide scores on measurement topics in addition to the grade.
If public pressure demands that students receive an overall grade or percentage score, a school or district can still employ the benefits of the approach shown in Figure 1 by including the bar graphs on a report card, along with traditional omnibus grades. The top part of the report card might display traditional grades and the bottom part, the bar graphs. Of course, if the 0–4.0 scale is used, it must be translated into traditional letter grades. Here's what this might look like:
3.51 to 4.00 = A
3.00 to 3.50 = A-
2.84 to 2.99 = B+
2.67 to 2.83 = B
2.50 to 2.66 = B-
2.34 to 2.49 = C+
2.17 to 2.33 = C
2.00 to 2.16 = C-
1.84 to 1.99 = D+
1.67 to 1.83 = D
1.50 to 1.66 = D-
0.00 to 1.49 = F
For example, the student whose bar graphs in mathematics are depicted in Figure 1 has an average score of 2.17, which translates to a letter grade of C. In addition to just noting this overall grade, teachers can include the bar graphs. That way, parents and students can see how much the student has learned about each measurement topic and ascertain the student's strengths and most pressing needs. Teachers can also apply proficiency scales to such areas as homework, cooperation, and personal responsibility (Marzano, 2010).
Recommendation 3: Expand the assessment options available to students.
Proficiency scales allow for three powerful classroom assessments that won't work if the teacher uses the 100-point scale in isolation.
Probing Discussions
When using a probing discussion, a teacher meets with a student and questions him or her about the measurement topic, making sure to ask questions that involve 2.0 content, 3.0 content, and 4.0 content. The teacher has the flexibility to continue asking questions until he or she is confident about a student's level of proficiency. At the end of the discussion, using the proficiency scale, the teacher determines the student's level of performance.
For example, if the teacher determines that the student has demonstrated adequate understanding of the simpler content (that is, 2.0 content) and partial understanding of 3.0 content, the student receives a score of 2.5. If the teacher determines that the student responds accurately to little 2.0 and 3.0 content independently but demonstrates partial understanding of this information with some cueing and prompting, the student receives a score of 1.0, and so on.
Unobtrusive Assessments
When a teacher uses an unobtrusive assessment, the observed student might not even be aware that he or she has been assessed. For example, assume that a physical education teacher has developed a proficiency scale for the overhand throw. Score 2.0 content might involve some of the simpler aspects of this skill, such as proper stance and arm position. Score 3.0 content—the target level of performance—might involve the coordinated timing of hip rotation and forward arm movement. Score 4.0 content would indicate an advanced level of performance, which might involve adapting the procedure to account for varying desired throwing distances.
Armed with this proficiency scale, the teacher walks onto the playground during lunch and observes a student executing the overhand throw, meeting the target level of performance just as it was taught. The teacher could record this score of 3.0 as an unobtrusive assessment.
Student-Generated Assessments
Student-generated assessments are perhaps the most powerful form of assessment that a teacher can make available to students. In such a situation, the student approaches the teacher and proposes what he or she will do to exhibit a specific level of performance on the proficiency scale.
For example, a student who is currently at a score 3.0 content level—following our example in Figure 2, the student is able to describe and exemplify what different plants and animals need to survive—might propose that she create a graphic organizer comparing plants and animals on specific traits and explain the graphic organizer to the class.
Recommendation 4: Allow students to continually update their scores on previous measurement topics.
Our fourth recommendation is probably the most transformational in its implications. As the school year progresses, teachers should allow students to upgrade their scores from previous grading periods. To illustrate, assume that the teacher addresses six topics during the first quarter. At the end of the grading period, he or she translates these into an overall grade. Now assume that he or she addresses six more topics in the second quarter. At the end of this grading period, the teacher once again translates these scores into an overall grade.
But what if during the second quarter, students work on content to raise their scores on the six topics from the first quarter? Of course, this means that the second quarter's overall grade would be based on the six topics addressed during the second quarter as well as on the six topics originally introduced during the first quarter. The third quarter grade would be based on the new topics addressed during the third quarter as well as on topics addressed during the previous two quarters, and so on.
This approach begs for a different kind of classroom. Some days, the teacher would address new content targeted for that quarter. Other days, students would work in formal or informal groups either on new content or on content addressed in previous quarters. One interesting option some schools have reported is to allow students to earn a score of 4.0 if they can tutor another student to score 3.0 status.
A Better Approach
Although there's no single best way to design standards-based grading and reporting systems, we have found that these four recommendations form the foundation for a system that's more accurate and informative than the current system and that stimulates new ways of thinking about assessment and instruction.