There are two myths concerning money and schooling. One holds that the United States spends more money on its schools than any other nation in the world. The other alleges that money makes no difference in student achievement, and that we should not “throw money at the schools.”
Myth One: We Spend More
The first myth—that we spend more than anyone else—was something of a mantra for the Bush administration. In the October 1993 issue of Phi Delta Kappan, a letter from David Berliner of Arizona State University quoted virtually everyone in the Bush cabinet as uttering some variation of it. Berliner said he couldn't find any evidence to support their claims.
To be more precise, what little evidence can be found is very odd. In the “Fourth Bracey Report on the Condition of Public Education” (1994), I took Herbert Walberg of the University of Illinois at Chicago to task for making the same claim. Walberg responded, citing data that indicated we did spend more money on education than any other nation. However, the definition of “the world” was most peculiar: it included the United States and five other nations.
Even using Walberg's preferred indicator of spending—dollars per student per year—if one moves to a longer, more representative list of 16 nations, one finds that the United States is only average in what it doles out to schools. If one calculates spending in terms of per capita income, the U.S. finishes 14 of 16 nations (see fig. 1). In the “Fourth Bracey Report” I used percent of Gross Domestic Product (GDP) for the 19 nations of the Organization for Economic Cooperation and Development (OECD). The National Center for Education Statistics (U.S. Department of Education 1993) used the same basis for its finding that the U.S. finished right in the middle of the pack.
Figure 1. Expenditures for K–12 Education as a Percent of Per Capita Income (1985)
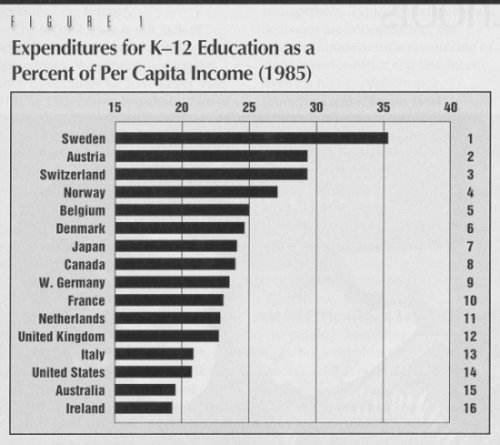
In his response, Walberg objected to this calculation on the grounds that different countries have different size GDPs. Just because a developing nation spends a lot of money on food, he contended, doesn't mean they eat well. This is a legitimate objection. However, when I recalculated the spending in terms of percent of per capita GDP, the United States position remained unchanged: ninth of 19.
Even this ranking is misleading, however, because less of the money appropriated in the United States actually reaches classrooms. This is not because an “administrative blob” exists in schools, as some have alleged, but because American schools provide services that other countries either do not provide or provide in reduced amounts. The United States is the only nation in the OECD where fewer than 50 percent of school employees are classroom teachers. Many of them are food service workers, bus drivers, counselors, special education teachers, and so on.
Myth Two: Money Makes No Difference
There are at least two versions of the second myth. One says simply that money does not matter, that there is no relationship between money and achievement. The other version contends that money has not mattered; we have been spending more money and haven't seen a commensurate gain in test scores.
IBM CEO Louis V. Gerstner Jr. (1994) claimed that “During the decade of the 1980s expenditures for education increased by 34 percent (in real dollars), yet the only outcome measures—test scores—were by and large flat.” This is precisely the same allegation—in the same words and syntax—that one of Gerstner's co-authors, Denis Doyle, made in a debate with me two years earlier. At the time I showed Doyle Figure 2, revealing that test scores had, indeed, become flat, but that they had become flat at all-time highs. Scores declined from the 1960s to the mid-1970s, then reversed and rose consistently to record levels.
Figure 2. Iowa Tests of Basic Skills
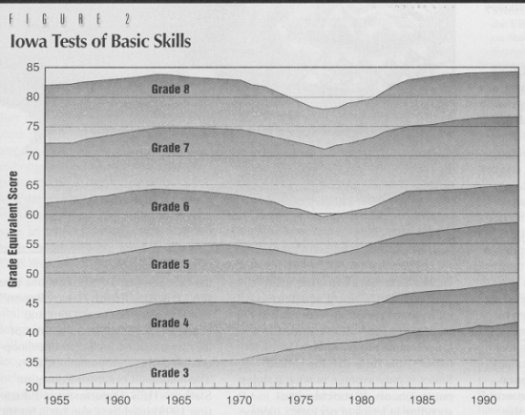
Thus, even if more money was being spent, scores were anything but flat during the 1980s. Richard Rothstein of the Economic Policy Institute (1995), however, has estimated where the money has gone, and the classroom does not get the lion's share. Rothstein's calculations are for the period from 1965, when average spending was $2,611 per pupil (in 1990 dollars) to 1990, when spending was $5,251 per pupil. He found that nearly 30 percent of the increase went into special education, while school breakfast and lunch programs accounted for 10 percent, and transportation accounted for 5 percent. Three percent went for programs to keep students from dropping out, nearly 30 percent of the increase went into creating smaller classes, and another 21 percent went into salary increases—which means that salaries grew less than 1 percent per year. Whether or not the reduction in class size contributed to the test score increase is unclear, as the reductions were not large and average class size remains at 24 pupils—above where one usually starts to see the effects of reduced size.
The first version of the “money doesn't matter” myth is based on calculations that correlate spending with test scores. When done for a state, such calculations will rarely show any strong relationship. This is because of what statisticians call “restrictions of range.” For instance, a Virginia Senate Finance Committee correlated spending and test scores for each of Virginia's 140 school districts. It found that “the best evidence available does not show a clear, linear relationship between achievement and spending.” But a look at Virginia's spending patterns shows why. The overwhelming majority of Virginia districts spend between $4,000 and $5,000 per pupil per year, a Senate Finance Committee report shows. This spending distribution has such a restricted range that it will never produce large correlations with anything (1993).
We can see the ultimate impact of restriction of range by imagining funding at zero dollars. Surely achievement would plummet. On the other hand, if we spent $35,000 per pupil—the average teacher's salary today—we could hire a tutor for each child. In this case, achievement would soar, as tutoring has been found to increase achievement by two standard deviations over usual classroom instruction.
Even given such restrictions in the range of variables, Robert Lockwood and James McLean (1993) found a significant correlation between the amounts that Alabama districts spent on instructional materials and test scores. Similarly, although there were a host of attenuators, Howard Wainer of the Educational Testing Service (1993) found a significant correlation between NAEP scores and per-pupil expenditures. Finally, in the list of empirical studies, Ronald Ferguson of Harvard (1991) found that when districts used money to reduce class size and hire more experienced teachers, test scores rose.
Former Secretary of Education William Bennett (1993) conducted a study using state per pupil expenditures and state-level SAT scores. One can certainly question the validity of the SAT as a measure of school quality, but Bennett purported to find no relationship. Pundit George Will (1993) used the study to pen a column, “Meaningless Money Factor.” Will observed that Bennett's data showed the top five states in terms of SAT scores were all low spenders, while New Jersey—spending more money per student per year than any other state in the union—finished 39th. What neither Bennett nor Will bothered to observe was that very few students in the top five states take the SAT; they are ACT states. On the other hand, 76 percent of New Jersey's seniors took the SAT.
One can only speculate about what would motivate Bennett to manipulate data in this way. During his tenure as Secretary of Education, the Department of Education continued to prepare the “wall charts” originated by Terrel Bell. These charts ranked states on a variety of indicators. Although I and many others question their usefulness, the charts at least recognized that the percentage of students taking the SAT varied from state to state. Hence, the charts divided states into two categories—SAT states and ACT states—depending on the dominant examination used. Thus, no matter what the relationship of these tests to educational quality, Bennett knew that neither of them was a valid indicator for all states. One also might assume he would have been aware of earlier studies showing that the variance in state-level scores was accounted for in large part by variations in the proportion of students taking the test (Powell and Steelman 1984).
Does Money Equate to Achievement?
Without question, the best known study of the relationship between money and achievement is that of Eric Hanushek (1989). It is widely cited by school critics, although it has been attacked on both logical and methodological grounds. One researcher (Baker 1991) even commented that, “there are so many serious problems with Hanushek's analysis, no one should take it seriously.”
As Baker pointed out, Hanushek never specifies how he made the decision that, “there appears to be no strong or systematic relationship between school expenditures and student performance.” Hanushek makes the claim, but never tells you why or on what basis. Baker argued that a reasonable rule would be to expect that 5 percent of the studies would find statistically significant results purely by chance. You could then check to see what proportion actually found significant results. Baker noted that 20 percent of the studies found a statistically significant relationship, and many more found a positive, although not statistically significant, relationship.
Baker also observed a logical flaw in Hanushek's analysis. Hanushek claims to have found no relationship between money and the level of achievement, then argues from this position that additional money would not increase achievement. But, as Baker pointed out, level of achievement is affected by a host of non-school variables. Indeed, a recent analysis shows that most of the variance in state-level NAEP scores can be accounted for by only four variables, none of which are under the control of the schools. They are: number of parents in the home, parental educational level, type of community, and state-level poverty rates for ages 5–17 (Robinson and Brandon 1994). Baker argued, with evidence, that increases in achievement are not nearly so affected by family and community variables as is level of achievement.
Finally, Baker observed that finding a relationship between money and level of achievement is a cause for shame, not joy. It means we're underfunding poor districts. By analogy, Baker explained that the relationship between money spent and death rates in hospitals is negative: Hospitals spend more money on cancer patients than on patients with an inflamed appendix. Indeed, they are obligated to spend the most money on the most difficult problems, even though more of these patients die. Additional money spent for children who live in poverty will not bring these children up to the levels attained by children from affluent areas—but it will help.
For the school year 1991–92, schools in Jericho, New York, spent $15,989 dollars on each student, while New York City spent $6,981. In Illinois, New Trier High School spent $12,198 on each child, while Illinois averaged $5,036. Nationally, as the percentage of students living in poverty increases, spending decreases. Does it make sense to think that these wealthy schools and districts are wasting their money? That New York City knows something that Jericho does not? Do poor districts know something that affluent districts do not? I think not. Money matters.