Teachers are, unfortunately, rarely invited to participate in policy discussions affecting their schools—either by local or state boards of education or by various legislative bodies, from state legislatures to the United States Congress. Over the last two decades, the field of demographics has become vitally important to education policymakers at all levels. What are the key demographics affecting educational policy? How can teachers make good use of demographics in their daily practice?
Key Demographics
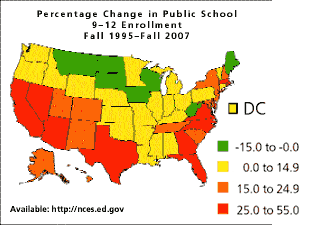
Nothing is distributed evenly across the United States. Not race, not religion, not age, not fertility, not wealth, and certainly not access to higher education. For example, only five states will have a 20 percent (or more) increase in school enrollments; most states will have smaller increases and about nine states will have declines. "Tidal Wave II," as U.S. Secretary of Education Richard Riley likes to call the new increases in enrollments, is a statistical fiction for the vast majority of states.
But what will happen where you work? That depends on your state and your location. About one-quarter of Americans live in big cities, half live in suburbs, and a quarter live in small towns or rural areas. If you live in a central city in the eastern half of the country, you can expect almost no enrollment increases and some decreases. Those who can, flee to the suburbs.
The inner suburban ring (where there is nothing between you and the city limits) will see a major increase in student diversity—more minorities, more immigrants, more students learning English as a second language (ESL), and more students from poverty. Teaching in an inner suburb will increasingly resemble teaching in an inner city. The second suburban ring (with one suburb between you and the city) will see some expansion in student enrollments, especially as you reach the beltway, which used to contain growth—like a belt—but is now the jumping-off place for growth. In these areas, parents do not commute to the central city; they live in one suburb and work in another.
Finally, enrollments in small towns or rural areas will be flat. But these places will have increasingly large percentages of elderly people. Older residents tend to "age in place," and whereas the young move away, some elderly do seek out small-town life.
Inner cities in the West tend to be economically flexible and porous whereas those in the East and Midwest rigidly segregate low-income people in the cities. Racial and economic segregation are almost the same thing in the East and Midwest, which have the 10 most racially segregated cities in the nation; none of the 10 most racially segregated cities is in the South.
Consider another kind of diversity: the percentage of youth who by age 19 have graduated from high school and have been admitted to a college. Attaining this status is, of course, the American Dream. Some states have 65 percent of their 19-year-olds in this category whereas others have 25 to 30 percent—a range that is far greater than any differences in scores between the United States and other nations.
One form of diversity that affects every teacher is transiency. Although about 3 million children are born each year, up to 40 million Americans move in that same time period, making mobility far more important than births in explaining population changes. Many teachers have 22 students in the fall and 22 in the following spring, but 20 out of the 22 are different students. Hospitals in these regions spend most of their time taking case histories from strangers. Each Sunday, ministers preach to congregations, a third of whose members are new. Transiency also relates to crime—knowing your neighbor will prevent you from stealing his lawnmower.
In addition, the states with the lowest rates of high school graduation and college admissions are the five most transient states in the United States. Most migration occurs within the same state, but about 6 to 8 million people move to another state each year. People in the New England, middle Atlantic, and midwestern states are moving to the Southeast and Southwest. In addition, a million immigrants each year are settling mainly in California, Texas, and Florida.
Percentage Change in Public School 9–12 Enrollment, Fall 1995–Fall 2007
Race Facts
The nature of race is changing. Fact one: About 65 percent of America's population growth in the next two decades will be "minority," particularly from Hispanic and Asian immigrants. These groups have higher fertility rates than Caucasians, whose fertility level is too low to even replace the current population.
Fact two: The 2000 Census allows you to check as many race boxes as you wish. As a result, Tiger Woods, who is a "Cablinasian," will be able to check Caucasian, Black, Indian, and Asian. But how do we score his four checks? Does he count as four people? Is each check mark exactly one-quarter of Tiger? Can he be counted as white for housing surveys and black for civil rights actions?
Fact three: Three million black Hispanics in the United States, mostly dark-skinned Spanish speakers from the Caribbean, have checked black on the census form because Hispanic is not a race. Although race is vitally important politically, economically, and historically, it remains scientific nonsense—Office of Management and Budget Directive 15, the guide for the census for more than 20 years, states that the racial categories in the census have no scientific validity.
Fact four: At least 40 percent of all Americans have had some racial mixing in the last three generations—including President Bill Clinton and Martin Luther King, Jr.—but only 2 to 4 percent will admit it on Census 2000. The blurring of racial identity will grow rapidly, however; children of Asian and Hispanic immigrants are marrying out of their parents' heritage at rates between 30 to 60 percent. In the 1900 immigration wave, an Italian's marriage to a German was called miscegenation, and the families would not speak to each other. Today, only 15 percent of European Americans are married to a spouse from the same country of origin, and we laugh about this outdated notion. Soon, Asians and Hispanics may do the same.
Diversity is increasingly unevenly distributed. In fact, the 65 percent increase in diverse populations will be absorbed by only about 230 of our 3,068 counties; California, Texas, and Florida will get about three-fifths of the increase. Remember that more than half of our entire population lives in only nine states—those three, plus New York, Pennsylvania, Ohio, Illinois, Michigan, and New Jersey—yet only California, Texas, and Florida are growing so quickly; the other six seem to be "wealthy but tired." Forty-one states compete for the other half of the population. Although we talk of "minority majorities," this phenomenon is only possible in a handful of counties. Whites will become a minority of the U.S. population around 2050, and you will have retired before then.
But the blurring of racial lines suggests the declining importance of race, and many people are lobbying for race data to be excluded from the next census because it tells many things that are not accurate. Most poor children in the United States are white, but a higher percentage of black and Hispanic kids are poor. Being black is no longer a universal handicap; over one-quarter of black households have a higher income than the white average, and rates of blacks who go to college and own homes continue to grow. But poverty is a universal handicap. If you have poor kids of diverse ethnicities as well as middle-class minorities in your classes, you know exactly what I mean.
Racial desegregation has not led to economic equality. Twenty percent of U.S. kids are below the poverty line today—exactly the same percentage as 15 years ago—even though most of the nation is less segregated and wealthier. This poverty rate is inexcusable in the wealthiest nation on earth. It is time to do what Kentucky has done—build an economic "floor" under every child in the state to equalize the investment in each child's education. That is economic desegregation, and many states are doing it. Our new understanding of the importance of children's preschool years has led many states to mandate a preschool program for all poverty-level children in the state, another attempt to equalize investment in every child and economically desegregate.
An Aging Population
We grow old. Although immigration and high minority fertility stall the trend, the U.S. population is steadily getting older, as are populations in other developed or industrialized nations. Census 2000 added an extra box for the state-your-age question because 57,000 Americans are now over 100 years of age, and 1.4 million are in their 90s. President Clinton, born in 1946 (a leading-edge baby boomer), will be 65 in 2011. By then, 65 will not be considered old—today, geriatrics defines middle age as 50 through 75 and old age as 75 and older. Of the baby boomers, born between 1946 and 1964, one in four will live past 85. Today, only one household in four has a child in the public schools.
President and Mrs. Clinton will soon have an empty nest when their daughter graduates from college and moves out. The question for schools: Will baby boomers (70 million of them) maintain their interest in public schools after their kids have left the educational system? Will they vote for bond issues for someone else's children? Or for raises for teachers to benefit someone else's children? The answer is key to the future of public school finance. Already, many school board meetings are dominated by today's much smaller group of citizens ages 65 and older who wish to be removed from the public school tax rolls. And remember the mantra from demographics to politics: As you get older, you vote more often. How will we convince seniors that their Social Security and Medicare trust funds will be replenished by today's high school students when they join the work force?
Differences in World Views
- The sense of time. Americans believe in the future as if it were a religion (except Californians, who seem to live in the eternal now). Many immigrants have a sophisticated sense of the past that puts us all to shame. Yet teachers usually motivate students on the grounds of a brighter future—when consistency with the past might be a better motivator for some students.
- The sense of family. Whereas most Americans are only aware of their nuclear family (parents plus their children), some Americans are from extended families—for them, a loan to buy a house might come from an uncle; a medical problem might be solved by an aunt. The extended family provides comfort, stability, and many services that the U.S. government typically provides.
- The sense of hierarchy. America is as "flat" as you can get on this score, but many newcomers are from rigidly structured societies in which children (and women) are considered inferior beings. Thus, the child enters school having been told by parents that teachers are authority figures. To show respect, they look at the floor when the teacher addresses them. Most teachers see this behavior as evasive and prefer students to look them straight in the eye, indicating honesty, trust, and interest in the class.
In many seminars, students are encouraged to disagree with their teachers to show their individuality. But in many nations and cultures, such behavior is called "putting yourself forward," often a major sin. Asian, Hispanic, and Native American kids seldom leap into the air, fists extended, saying "Yes! I'm wonderful!" Indeed, at one high school graduation I attended, the valedictorian downplayed her own talent and hard work, declaring that the award belonged to her entire family and that her family should be on the stage with her (they later joined her there). This behavior was not excessive modesty: The young lady truly believed that the honor was her family's achievement, not just her own.
Demographic Tips for Teachers
- If a student is presented in records as "Hispanic," make sure you know what country that student's family is from, what language the family uses at home, and whether the parents also speak English and how well. If parents speak only Spanish and you speak none, try to get a colleague who is bilingual to be on the line during your first phone call home.
- If a student won't look you in the eye during the first week of school, don't make a big deal of it in front of the class. Take a minute to ask the student about it privately.
- Find out as soon as possible which of your students is new to the area and may need some help in getting settled. If half your students (or fellow teachers) are new in town, be prepared for some problems. Transiency often brings out the worst in people at any age.
- Even though students may choose to sit with their racial or ethnic groups in the cafeteria or in other informal settings, your classroom must value all students. Rather than "color blind," your goal should be "culture fair."
- Pay particular attention to your students who are eligible for free or reduced-price lunches—they may need extra help and may not get enough to eat on weekends. (There should be no "Title I pullout program" that identifies low-income students in your classroom.)
- If you have lots of diversity in your classroom, try to use as many different visual presentations as possible. Pictures can often convey meaning when words do not.
- Some students may be genuinely confused about their ethnic ancestry. Several state courts have indicated that it is illegal to force a child to choose between the mother's and father's backgrounds. Although it's a sensitive issue, you can communicate clearly to your class that you value all children and that you expect them to do their best. The important thing is the understanding that we are all Americans, regardless of our backgrounds.
- Make a list of student successes for any ethnic group in your school, whether in your class or not. It's the perfect defense against the student who says, "You just don't understand! No one from [country x] can do [math/English/science].
- Some students may be the responsibility of grandparents—more than one million public school students are. If so, make sure that the grandparents get the same level of attention that you give to biological parents—they may need even more help.
The Importance of Demographics
We have only scratched the surface regarding the impact of demographics on education and on the president of the classroom—the teacher. All of these demographic changes are coming soon to a classroom near you.