Total Quality Management can help school districts systematically bring about change. Its holistic approach accents systems theory. Its tools provide vehicles for data analysis and decision making. Its principles accent the importance of each person in the system to strive for continuous improvement.
The City of Burlington Public Schools' involvement with Total Quality began in March 1992, when the Education Focus Group of the Quality New Jersey project selected our district to participate in a pilot program. Quality New Jersey was founded in 1988 to encourage the use of Total Quality Management methods throughout the state for “the continual improvement of industry, service, health care, education, government, environment, and quality of life in New Jersey.”
In all, six school districts, Brookdale Community College, and the Urban Division of the Department of Education are participating in the program. We were all chosen because of our interest in learning about Total Quality and our representation from urban, suburban, and rural districts across the state. Each local Quality Improvement Leadership team consists of five members: the superintendent, a business administrator, a district curriculum supervisor, the building principal, and a teacher (or comparable positions from the college or department of education). Each team has made a two-year commitment to the program.
Businesses sponsoring the Total Quality Learning and Support Program are AT&T, Bellcore, PSE&G, and Xerox. All training costs (instructors, meals, guest speakers, facilities) for the program are furnished by our sponsors. The training—five events are scheduled each year of the program—is structured around the principles of Total Quality Management, Process Quality Management and Improvement, problem-solving techniques, quality tools, and team building. Trainers from AT&T and Bellcore conduct the sessions, which have been jointly planned by business and education representatives.
Every month facilitators from the business sponsors visit the local Quality Improvement Leadership teams to assist us in determining improvement opportunities and in implementing them. They also instruct the teams in using the basic tools of Total Quality as specific needs arise in the improvement process. These tools include checksheets, graphs, Pareto charts, Ishikawa or fishbone diagrams, histograms, scatter diagrams, and control charts.
Our Quality Improvement Story
The improvement issues the City of Burlington Public Schools face reflect the needs of a small urban school system with 1,500 students. Being involved in the program gives us an opportunity to observe these issues more holistically and provides us a variety of tools to assist in our analysis. The first issue we decided to address was attendance at the district high school. To do so, we used a detailed problem-solving process, called the Quality Improvement Story. While a number of businesses now use this process, it was Walt Disney who invented the storyboard during his development of Snow White. Using a large wallboard, Disney and his staff illustrated the macro-events of the story, which served as a guide for further development of the story's micro-events.
Having studied how to develop Quality Improvement Stories with AT&T facilitators, our team used the seven-step process to apply Total Quality principles and tools to our own improvement efforts.
Step 1: Reason for Improvement
As our theme for improvement, we chose: decrease high school tardiness and increase attendance. At that time, high school attendance fluctuated from 85–92 percent.
- tardiness data from September 1, 1991–April 30, 1992;
- the number of students marked absent who were actually just late;
- teacher corrections to the attendance list and absences from September 1, 1991–April 30, 1992.
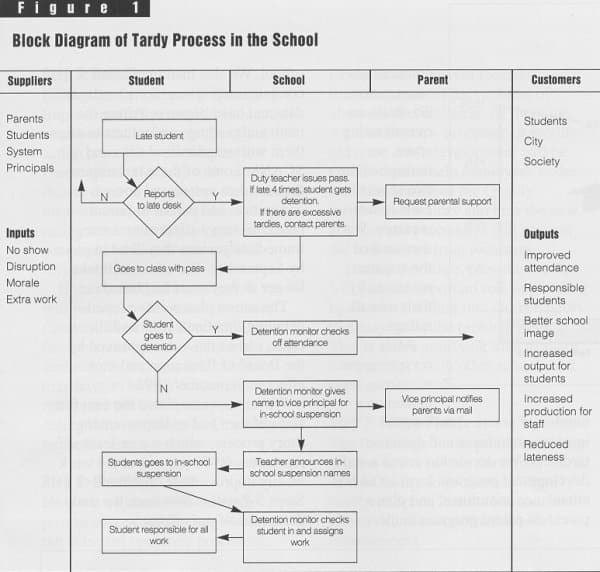
Figure 1. Block Diagram of Tardy Process in the School
Step 2: Current Situation
Our target for improvement was: an attendance rate in the high school in excess of 95 percent. By correcting our tardiness data, we believed we could improve that rate immediately. Then we could determine why the remaining students didn't attend school and begin developing solutions.
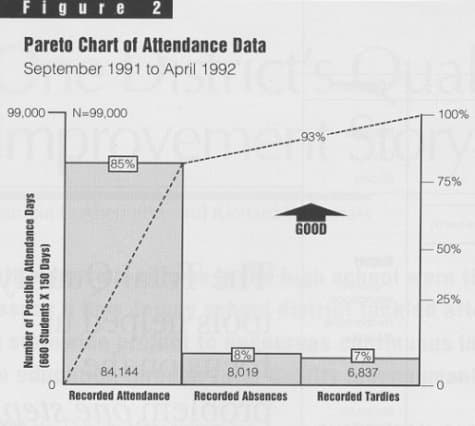
Using Pareto charts we stratified our improvement theme. After reviewing data about recorded attendance, absences, and tardiness, and teachers' corrections to the attendance data, we confirmed that students who missed homeroom were being marked absent even if they attended classes all day. We created two Pareto charts, one to show attendance data and a second one for tardy/absence data. Figure 2 is our Pareto chart for attendance data; actual numbers are on the left, percentages are on the right, and histogram bars represent subsets of the overall issue. The teachers on the Quality Improvement Team broke into groups to learn this tool and then used these charts to explain these data to the entire team.
Figure 2. Pareto Chart of Attendance Data
Step 3: Analysis
After we corrected these tardy data, the high school attendance rate was up to a monthly average of 92 percent. Our next step was to determine the root causes of nonattendance for the remaining 8 percent of students' absences.
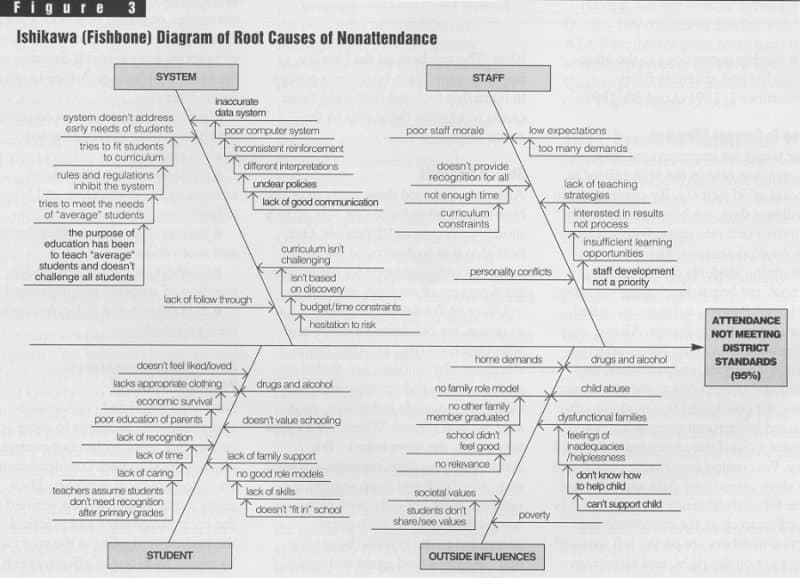
Using an Ishikawa (fishbone) diagram, we conducted a cause-and-effect analysis (fig. 3). After brainstorming why students are absent or tardy, we grouped reasons into four categories: outside influences, staff, student, and system. Whenever a cause was given, the team asked “Why?” Asking this question repeatedly forced us to step back and keep searching until we were left only with root causes. In Figure 3, each arrow connected to the central (bone) line had “Why?” asked again and again until there were no more whys to ask. The answers to these why questions are indented under the first idea. The last answer (in bold face in the figure) generally indicates the cause, not the symptom. It took great patience to probe in such a way, so different from the modus operandi of school systems. In education the tendency to address symptoms, not causes, is the reason the same problems resurface in other forms later on.
Figure 3. Ishikawa (Fishbone) Diagram of Root Causes of Nonattendance
- students are not challenged enough by the curriculum and how it is implemented;
- parents lack appropriate education and motivation;
- teachers lack sufficient understanding of students and their needs;
- data system and policy/procedures aren't aligned.
Step 4: Countermeasures/Potential Solutions
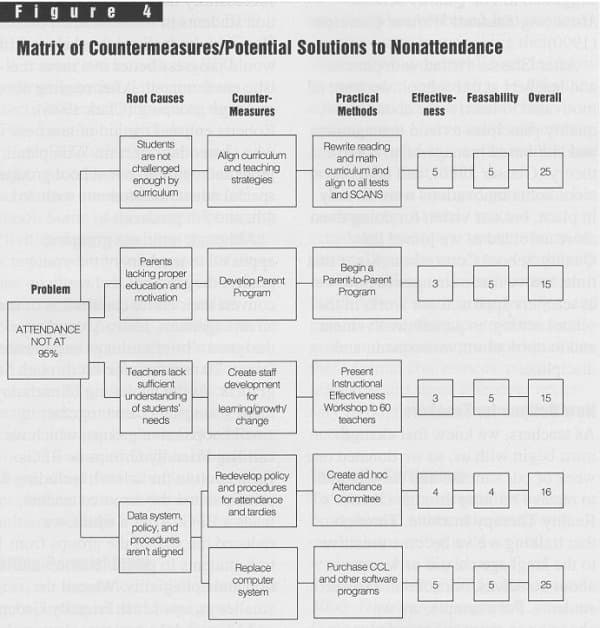
Next we formulated countermeasures/potential solutions to those root causes that were within our control to change. Next to each countermeasure, we listed practical methods. Then using a matrix (fig. 4), we verified that the countermeasures and practical methods would address the root causes by rating each one in effectiveness (How much will it reduce the root cause?) and feasibility (How much time, money, and so on are needed?). On a scale of 1 to 5, 5 represented the most effective, feasible measure. After analyzing these two criteria separately, we added the scores to the countermeasures matrix. To obtain an overall rating score, we multiplied the two scores for each countermeasure. We then ranked the countermeasures by their overall ratings.
Figure 4. Matrix of Countermeasures/Potential Solutions to Nonattendance
After reviewing our resources, we agreed on a number of practical methods to improve attendance and decrease tardiness. We decided to create a staff development program, form an ad hoc attendance committee, and plan a parent-to-parent program in the school. We also instituted a new computerized system for attendance data and have begun rewriting the math and reading curriculums to align them with standardized tests and SCANS. Some of these techniques—the new data system, ad hoc committee, and parent-to-parent program—may affect attendance immediately, since they'll be in place by September. The others will take longer as they must be phased in.
The action plan we developed—detailing timelines, responsibilities, costs, and so on—was approved by the Board of Education and took effect in September 1992.
We've now completed the first four steps of the Quality Improvement Story process, which we've learned represents 60–70 percent of the work on any improvement opportunity. Steps 5–7 will follow once we study the results of our efforts.
Step 5: Results
During the fifth step, the Quality Improvement Team will meet once a month to review the results of our action plan. We will compare the Pareto charts (Step 2) with current data to determine whether the practical measures we've instituted are eliminating the root causes of student tardiness and absence. If not, we will revise our plan.
If the methods are successful, we will further stratify the root causes (Step 3). Then we will address other fundamental causes. Additional countermeasures and practical methods may have to be implemented if the results are not satisfactory in eliminating the root causes and meeting the target for improvement.
Step 6: Standardization
Next we will make the methods proven successful (in Step 5) part of our standard operating procedure. Doing so will prevent recurrence of the root causes of the problem of absences and tardiness. At that time, we'll create new processes or modify old ones. Staff development will be crucial then to help employees understand the results of the Quality Improvement Story and how the new policies and procedures will prevent the root causes from recurring.
During this stage, periodic checks will play an important role in guarding against backsliding into old behaviors that may cause the problem to recur. This is also a gratifying time to share our successes with other schools and other professionals.
Step 7: Future Plans
The final stage in the problem-solving process is to evaluate the effectiveness of the Quality Improvement Team itself, reflect on lessons learned, and identify further opportunities for improvement.
Our Stories Have Just Begun
The Quality Improvement Story process provided us a framework around which to improve attendance in our district high school. The Total Quality tools helped us focus on the problem one step at a time. We were able to combine subjective opportunities (the countermeasures matrix, defining the theme and the target for improvement) with data that provided opportunity for management by facts (the block diagram, Pareto charts, feasibility and effectiveness matrices). Throughout the process we were reminded not to jump to solutions— but, rather, to analyze a problem completely before deciding on concrete actions.
- those closest to any improvement opportunity should be involved in its solution;
- learning and leadership are everyone's responsibility;
- decisions must be made with facts;
- understanding systems theory is central to quality;
- continuous improvement is the norm for all activities and not the exception.
Although our Quality Improvement Team members are novice practitioners of Total Quality, we are convinced that the process presents valuable opportunities to systematically bring about change in our school system. We are well on our way to improving our local school system, one story at a time.