
So you want to be a principal. Did you know that 25,000 principals leave the profession each year, and 50 percent of new principals quit by their third year (School Leaders Network, 2014)? Knowing this, why do you want to be a principal? To give you more insight, let's explore the facts behind principal churn and present a tool for gathering data for increasing the likelihood of success.
Effect of Principal Churn
The first year after a principal quits, retires, or is replaced, schools typically see decreases in student achievement in math and reading (Branch, Hanushek, & Rivkin, 2008), and it can take up to three years to regain a positive momentum (School Leaders Network, 2014). Principal churn affects students, schools, and entire communities and is an acute problem at lower-achieving and high-poverty schools. Principals are the influential change agents in schools, second only to teachers in influencing student learning (Leithwood, Seashore Louis, Anderson, & Wahlstrom, 2004).
Churn affects efforts to produce sustained school improvements and reform. It takes an average of five years to put in place the practices that affect a school's performance (Seashore Louis, Leithwood, Wahlstrom, & Anderson, 2010). Leaders, just like employees, have a "honeymoon" period for acclimating to the school and the new organizational culture. During this honeymoon period, principals and teachers explore their relationship and the principal's initiatives with the school practices and culture (MacMillan, 2000). In sports, this period would be called the "rebuilding year" and the fans would not expect much from their team. The problem in the context of schools is that we are talking about children's lives and futures. This rebuilding year affects a school district's achievement gap, and the more rebuilding years there are, the larger the gap becomes.
The Principal's Role
The role of a principal has become increasingly complex. It involves creating a vision of academic success for all learners; developing a climate for learning; instilling leadership in others; evaluating instruction; managing school events; gathering and analyzing data for school improvement, standards, and achievement; developing and maintaining a social media presence; and engaging parents and community members—just to get started. As the preferred teaching style has changed from "sage on the stage" to "guide on the side," principal leadership styles need to change from manager to instructional leader who provides clarity on what is essential, what needs to be done, and how to get it done, a model suggested in Jim Collins's 2001 book Good to Great.
To accomplish all the tasks at hand, today's principals need to cultivate leadership in others. A study by the Universities of Minnesota and Toronto showed that principals who created a strong climate for instruction also spurred leadership traits within the faculty (Seashore Louis et al., 2010). The report showed that when principals are willing to share leadership among colleagues, student performance on math and reading tests increased. Just as teaching requires different methods to meet different student needs, different contexts require different styles of leadership. Schools benefit from being able to draw from a diversity of leaders' strengths.
School-Data Framework
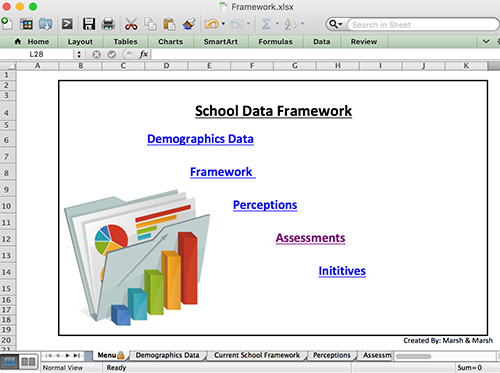
Today's instructional leaders need to be able to make these decisions based on a clear representation of their school's context. For adding clarity and efficiency to the myriad tasks of the principalship, we suggest using the embedded spreadsheet as a tool to organize a school's information. The spreadsheet covers five areas: demographics, framework, perceptions, assessments, and processes. These five areas help education leaders make informed decisions based on data. Prospective principals typically gather much of this information as part of their preparation for job interviews.
Demographic Data
The demographic data describe the students, the school's staff, the school, and the surrounding community. Demographic data in education often include the following information:
- Number of students
- Gender
- Number of students with special needs
- Number of ESL students
- Number of gifted students
- Socioeconomic level
- Student attendance
- Ethnicities/races
- Graduation rates
- Attrition rates
- Number of teachers and years of experience
- Teacher assignments
The demographic information identifies the current context of the school and tracks trends. By disaggregating demographic data, leaders are able to understand the influence the school is having on different groups of students. Disaggregating data by different student populations will show which students are excelling and which are falling behind. New principals need to have this information at their fingertips to be able to answer questions and make decisions.
School Framework
To understand the school framework, the principal must first understand where the school stands on its vision, mission, goals, and objectives. It can be frustrating to have a new leader come in and attempt to implement a new shared vision when the school's stakeholders just went through the process a short time before. If a school framework is in place, then the new leader should become familiar with the plan, the process for creating it, and its alignment to the district plan. If there is not one in place, or the one that is in place is not working, then this is an opportunity for the principal to work with the team and shine.
If the framework is in place and has some traction, then the new principal might be wise to find a way to work with a group to modify the incomplete elements and build consensus, versus throwing out the current system and starting the mission and vision building process anew.
Perceptions
Closely aligned to the framework are the perceptions of the school's culture, climate, values, and beliefs. Just as with the framework, the new principal needs to understand these perceptions before making changes. Understanding the perceptions requires a lot of listening, which is often hard for leaders who want to come across as knowledgeable and in control.
Perception data allows new principals to understand what students, staff, and parents are thinking about and expecting from their school. Gathering data—through questionnaires, interviews, and observations—helps leaders determine whether their own perceptions match reality experienced by students, staff, and parents. When collecting data, principals should ensure that they are talking to a wide range of people, not just those who are overly negative or positive. Additionally, principals should try to align perceptions to available data to determine whether they are accurate.
Assessment
Assessment plays a major role in how students learn and how teachers teach. Student learning data comes from screening assessments, diagnostic assessments, classroom assessments, classroom assignments, formative assessments, state assessments, standards assessments, and grades. Assessment data allows new principals to know whether students are learning what they are supposed to be learning and whether the school is meeting the instructional goals.
Initiatives
Initiatives refer to the projects administrators, teachers, and staff complete to achieve the school vision. The previous principal, the district, or even a grassroots organization at the school may have initiated these projects. The new principal must first know what the initiatives are, their backgrounds, and whether they are achieving their goals and getting results before determining whether they should be continued. Again, the principals need to gather the data to understand whether these initiatives are worth the resources they will consume.
The included data tool, or one similar to it, will help prevent random leadership acts and provide a framework for making focused, data-driven decisions for school improvement. When principals have a better understanding of the role they are stepping into, they are more likely to be successful and grow in their leadership at a school. And with stable leadership, school can break out of the effects of principal churn, and make real progress toward closing achievement gaps.