This is a warning against complacency. A flurry of recent reports have portrayed education quite positively (Bracey 1991, 1992b, 1993; Carson et al. 1993; Huelskamp 1993; Rotberg 1990). Thanks to them, we can now say confidently that U.S. schools are not in a general decline, but this good news is only part of the story.
No Better; No Worse
Student achievement in most subjects is at about the same level it was 10, 20, and even 30 years ago (Stedman 1993). During the 1980s, most test scores remained steady and some even improved. There was no “rising tide of mediocrity,” as the Reagan administration's A Nation at Risk report maintained. Moreover, high school completion rates are higher than they have been in decades. The research has also successfully challenged the popular notion that in international comparisons, the United States consistently ranks near the bottom. In the most recent assessments, for example, American 9-year-olds ranked second in the world in reading and third in science, while our 14-year-olds had reading scores in the top third of the tested countries (Stedman 1994a).
Given the enormous changes in school populations and in the society at large, this generally stable educational achievement is impressive. Educators and school officials, who have felt unfairly disparaged for a decade, understandably have welcomed these findings.
The bad news is that these findings have prompted a one-sided, rosy portrait that threatens to foster complacency. This outlook—a new mythology about U.S. education—could stand in the way of much-needed educational reform.
Separating Fact from Fiction
- There really wasn't an SAT decline.
- Test scores are at all-time highs.
- The top half of American students are internationally competitive.
- The crisis in education is not general; it concerns inner-city schools and poverty.
Although U.S. schools are not in a general decline, student performance remains low. Students have done well internationally in reading, but their performance has been dismal in mathematics, uneven in geography, and often poor in science—particularly at older ages. Fundamental school reforms are warrented—including far-reaching overhauls of funding, governance, organization, pedagogy, and evaluation.
Myth 1: There really wasn't an SAT decline
The new mythology attributes the SAT decline entirely to demographic changes. Analysts at the Sandia National Laboratories claimed that the reason “is not decreasing student performance,” but more students from the bottom half of their high school classes (Carson et al. 1993). Bracey points to the dramatic growth in minority test takers—from less than 3 percent to over 25 percent—and concluded that “no decline exists or ever existed” (1991).
In fact, changes in class rank were minor, and there was a major decline in white students' scores (Stedman 1994b, Murray and Herrnstein 1992). Factors that did depress the scores included changes in students' social class, region, type of high school, age, and birth order. In addition, more nonselective universities began requiring the SAT. According to the most careful analyses, compositional changes explain about 50–75 percent of the SAT decline (College Board Advisory Panel 1977, Morgan 1991, Stedman and Kaestle 1991). Even Harold Howe (1985), the former U.S. Commissioner of Education, who mischievously called for another SAT decline because it would mark another expansion in educational opportunity, believes that only half the decline was caused by demographic changes (1985).
The best evidence suggests that there was a real decline in SAT scores in the 1970s, particularly in verbal performance. If one believes that the verbal skills that the SAT measures are a significant part of academic literacy and thinking, then the decline could represent a somewhat worrisome deterioration in educational quality.
The SAT test, however, is largely one of endurance—students must answer more than 200 questions in three hours, or more than one a minute. It does not measure achievement in most high school subjects. The test's origins help explain its limitations. Carl Brigham, who created the SAT for the College Board, had helped run the Army's World War I testing program (Gould 1981). Although he later recanted, he became convinced there were racial and ethnic differences in intelligence. In developing the SAT, he copied the Army Alpha test's worst features: ranking test takers by mental aptitude rather than by academic achievement; stressing verbal and numerical gymnastics, and speed; and using analogies, antonyms, and math puzzlers. In addition, both tests suffered from a cultural bias that perniciously sorted out army draftees and college prospects.
The recent SAT revisions are largely cosmetic. Replacing the word “aptitude” with “assessment” should help the Educational Testing Service market the test in an era of authentic assessment. But the open-ended math problems will still be few, the new writing sample will be optional, and the deleted antonyms section will not be replaced by subject matter questions.
Other SAT-related evidence counters the notion of an educational decline. Scores on the College Board achievement tests—which do measure academic achievement—rose over the past decade even as more students took them. And the scores of nationally representative samples of high school students who took the PSAT, a short version of the SAT, were generally stable from the 1950s through the 1980s.
Myth 2: Test scores are at all-time highs
Some say most test scores have been improving (Tanner 1993), but there are even stronger claims that “achievement is at an all-time high in nearly all test areas” (Wilson 1994, see also Raspberry 1993 and Bracey 1991) and that our public schools are now “better than they ever have been” (Wilson 1994, see also Bracey 1992b). Both claims are only partly supported by the evidence.
Many elementary school tests have shown improvements in reading and mathematics. Scores on some of these, such as the Iowa Tests of Basic Skills (ITBS), are indeed at all-time highs. But these gains likely were as much a result of teaching to the test as genuine improvement (Linn et al. 1990, Stedman and Kaestle 1991). The Lake Wobegone effect (Garrison Keillor's fictional town where all the children are above average) is too well established to be ignored, even in test publishers' renorming studies.
Linn and his colleagues concluded that the renorming gains were partly caused by students' “familiarity with a particular form of a test.” The back-to-basics movements of the 1980s also may have helped improve scores at the expense of learning by focusing on frequent testing and a narrow skill-based curriculum.
The secondary school test score evidence is mixed. On many indicators, these students are not performing as well as they once did. Reading scores on the MAT and SRA declined in recent renormings (Linn et al. 1990), and high school gains on the Stanford achievement tests evaporated in the late 1980s (Rothman 1991). Scores on the National Assessment of Educational Progress (NAEP)—our best barometer of national achievement—are also not at all-time highs. While 17-year-olds' reading and mathematics scores have been basically level, their science scores fell greatly during the 1970s and rebounded only part way during the 1980s (see fig. 1). Their civics scores have been declining slowly since the 1970s.
Figure 1. NAEP Science Performance of 17-Year-Olds, 1969–1990
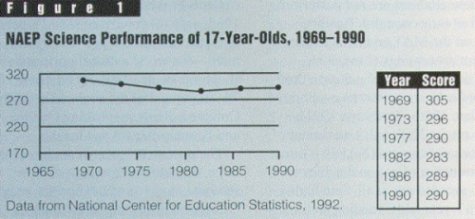
NAEP reading scores of 9- and 13-year-olds have generally held steady for the last two decades.
Myth 3: Our top half is internationally competitive
According to the new mythology, the top half of our students do well in international comparisons (Basler 1993; Bracey 1992b, 1993; Raspberry 1993; Wilson 1994). This claim originated with Westbury's research comparing American and Japanese achievement (1992, 1993). His studies, however, involved only one subject—mathematics—and used data that were more than a decade old! Back then, the top half of our 8th graders did well in arithmetic, but lagged greatly in algebra, geometry, and measurement. Popularizers have ignored Westbury's analysis of American calculus classes, which was telling because it tested our best math programs given to our best students. These classes fared poorly, substantially trailing the average Japanese class in every area tested (Stedman 1994a).
In recent assessments, American students have consistently performed near last in mathematics (see fig. 2). In 1991, for example, the United States finished 14th out of the 15 countries whose populations were comprehensively sampled. The top half of our students also have not kept pace. In 1988, only 40 percent of U.S. 13-year-olds reached middle proficiency in math—the worst national performance (Lapointe et al. 1989). By contrast, 70–80 percent of the students in British Columbia, French-speaking Quebec, and Korea achieved this level.
Figure 2. Mathematics Performance of 13-Year-Olds, 1991 (Average Percent Correct)
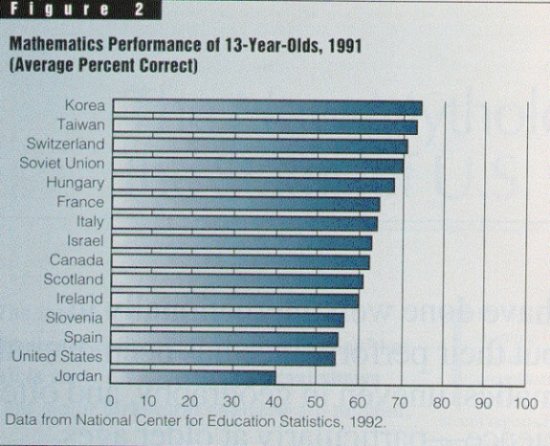
The gaps in science were almost as large, with only 42 percent of U.S. students reaching middle proficiency. Clearer evidence supports Tanner's (1993) narrower claim that our best students—the top 10 percent—are competitive. This is true even in math and science, where our 95th percentiles match those of most other countries (National Center for Education Statistics 1992). (The 95th percentile roughly reflects the average performance of the top 10 percent.) To the extent that there is a connection between academic achievement and economic competitiveness, we need more than the top slice of our students to be world-class.
Our nation's poor position has been attributed to the misleading nature of rankings, but in math, the rankings have reflected large differences in performance (see fig. 2). Geiger (1994), president of the National Education Association, tried to explain away the results by claiming that “most international comparisons rate all American students against the top 20 percent of students from other countries,” but this is simply untrue.
In reading and elementary school science, American students have been among the world leaders (National Center for Education Statistics 1993). This is important and overlooked news, but even so, we have a serious problem: Our students seldom read on their own, have little outside interest in science activities, and spend far more time watching television than reading or doing school work (Stedman 1993).
Myth 4: The crisis in education is not general; it concerns inner-city schools and poverty
Although the recent reports have acknowledged that education could be better—schools can always use some improvement—they explicitly reject the view that the “typical school is failing” (Bracey 1992b). Instead, these researchers have argued that reform should focus on urban minority students because the system “works well for others” (Bracey 1992a, 1993; see also Carson et al. 1993, Hodgkinson 1991, Houston and Schneider 1994.
- Mathematics. NAEP analysts recently concluded that less than half of high school seniors “appeared to have a firm grasp of 7th-grade content,” and only 5 percent “attained a level of performance characterized by algebra and geometry—when most have had some course work in these subjects” (Mullis et al. 1991).
- Reading. In the 1992 NAEP reading assessment, only 37 percent of our seniors demonstrated proficiency, while a quarter were unable to reach the basic level.
- Writing. Most high school students are competent in punctuation and grammar, but have weak expository, narrative, and compositional skills. Few have performed well on the NAEP writing tests. Only about a third wrote adequate papers, and only a small percentage were able to write “elaborated” papers.
- Literacy. Outright illiteracy in this country is rare. Contrary to an old canard, our high schools are not graduating scores of illiterates (Stedman and Kaestle 1987). Nevertheless, our functional illiteracy rate continues to hover around 20–30 percent—meaning that millions of Americans have trouble with common day-to-day reading tasks. The latest national study of adult literacy suggests that the problems may be even more extensive (Kirsch 1993).
- History. Many students' basic historical knowledge is poor (see fig. 3). In the late 1980s, national assessments showed that about two-thirds of our 17-year-olds could not date the Civil War, did not recognize Upton Sinclair and Ida Tarbell as muckrakers, and did not know that the Scopes trial dealt with evolution. A New York Times survey of college freshmen in the 1940s revealed similar weaknesses.
- Geography. In 1988, the Gallup Organization repeated a survey given to adults in 1947 and concluded that “Americans' geographic literacy has gotten worse in the last 40 years.” They found that “from outline maps, the average American can identify only 1 of 12 European countries, less than 3 of 8 South American countries, and less than 6 of 10 U.S. states” (Gallup Organization 1989). Geographic knowledge was also low in the 1940s, however. Even though World War II had just ended, U.S. adults could identify only half of the major countries in Europe!
- Civic literacy. Civics knowledge has remained at modest levels since World War II. In spite of increased educational attainment and media coverage, the public still knows little about the structure of government, basic political and economic concepts, and major political events and issues.
- General knowledge. Problems with general knowledge also have a long vintage. In the late 1950s, for example, high school graduates, ages 25–36, averaged only 34–65 percent correct on items dealing with public figures, current events, history, humanities, geography, and science.
Figure 3. Percent of High School Seniors Answering NAEP History Questions Correctly
Special Topic / The New Mythology About the Status of U.S. Schools - table
68% | President Abraham Lincoln wrote *the Bill of Rights *the Emancipation Proclamation *the Missouri Compromise *Uncle Tom's Cabin |
|---|---|
| 43% | The Missouri Compromise was the act that *granted statehood to Missouri but denied the admission of any other new states *settled the boundary dispute between Missouri and Kansas *admitted Maine into the Union as a free state and Missoui as a slave state *funded the Lewis and Clark expedition on the upper Missouri River |
| 41% | Who is associated with the founding of settlement houses to help the urban poor? *Jane Addams *Cary Nation *Susan B. Anthony *Mary McLeod Bethune |
| 31% | What is Magna Carta? *The Great Seal of the monarchs of England *The foundation of the British parliamentary system *The French Declaration of the Rights of Man *The charter signed by the Pilgrims on the Mayflower |
Ravitch and Finn 1987.
What Can Educators Do?
- How well are your students learning your curriculum?
- Can your students demonstrate high levels of general knowledge as well as sustained problem-solving?
To judge this and encourage high intellectual standards, your district should consider adopting performance assessment, standardized tests of subject matter knowledge, and exhibitions of mastery for graduation.
- Are students well-read?
- Do they have a work ethic?
- Do they have a sense of ethics, civic activism, and social responsibility?
We are, after all, preparing students to participate in a democratic society, so reform should not become a mere quest for higher test scores.
The quality of school life is also important. The environment should be safe and supportive, the students treated with respect and challenged intellectually.
I would recommend setting up teams of students, teachers, parents, community leaders, and school officials—one for each school and one for the K–12 system—to create ethnographic portraits of school life. This new form of assessment is invaluable; Elliot Eisner's work (1991) can guide the effort. The teams could use these portraits to prepare comprehensive reform plans that the public would debate.
The teams should consider proposals from across the educational spectrum—E.D. Hirsch's Cultural Literacy, Mortimer Adler's Paedeia Proposal, Ted Sizer's Horace's Compromise, and Ann Bastian and colleagues' Choosing Equality (1985). The process is as important as the product. A deliberative, democratic, and community-driven inquiry is essential; it must not be school district-directed and-dominated.
In sum, while education at the national level is not deteriorating, it is certainly not succeeding. At the local level, concerned educators and community members should determine how extensively schools need to be reformed and in which directions to take them.