

Schools across the United States are faced with the challenge of determining how to deliver and monitor interventions for struggling learners. Yet for many schools, no formal process exists. As educators navigate processes such as Response to Intervention (RTI) and Individualized Education Programs (IEPs), many questions arise: How can educators coordinate interventions across courses and subject areas? How can they monitor and report student progress so all stakeholders can understand and use the information? How can they determine whether an intervention was successful?
In fact, progress monitoring and reporting is the federal special education requirement with which schools struggle the most (Etscheidt, 2006). For students with disabilities, schools follow specific procedures for developing an IEP, which involves selecting targeted goals and services. But even the IEP is not sufficient to guide daily intervention and progress monitoring. Instead, IEPs create the broad structure from which educators can develop a more detailed and practical day-to-day intervention plan.
Teachers face similar intervention and progress monitoring challenges with other struggling students (Bolt, Ysseldyke, & Patterson, 2010), including English language learners (ELLs) and students receiving supports through RTI. Several approaches have been recommended for implementing RTI models at different grade levels and across subjects (Mellard, McKnight, & Woods, 2009). Because RTI's roots lie with early reading development, the resources for elementary general literacy outcomes are rich. However, in other subject areas and at the secondary level, far less practical guidance is available (Fuchs, Fuchs, & Hollenbeck, 2007).
Crucial Features of an Intervention Plan
Education leaders need an effective intervention planning and progress monitoring process that is practical for implementation schoolwide. Having worked with many schools and preservice teachers on how to write intervention plans and take down data, we have developed an intervention planning process that schools can use with any struggling learner. This process works for students who don't qualify for special services; it also layers seamlessly over an existing IEP or RTI structure.
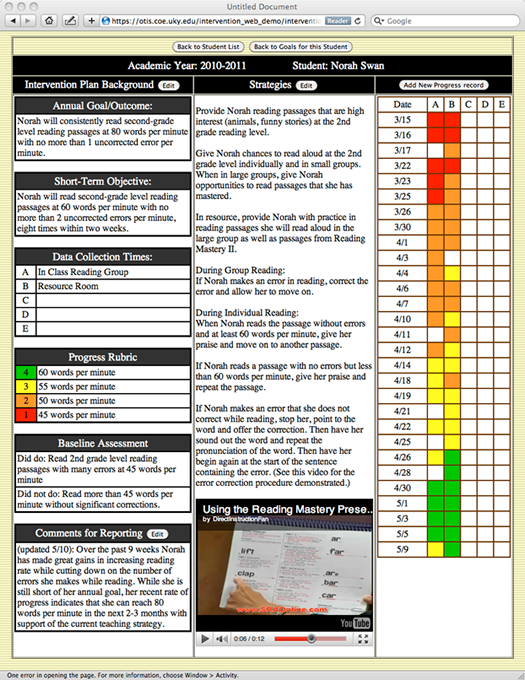
The form in Figure 1, which shows a sample intervention plan, is integral to the process. Based on the work of Baird (1994), it has five crucial features.
Figure 1. Screen Shot of the Main Screen of the Web-Based Intervention Plan
Feature 1: Measurable Outcomes
All intervention planning begins with determining measurable outcomes. Two types of outcomes are included in the intervention plan: an annual goal and a short-term objective (both are on the top left of the form).
Annual goals provide the target that guides intervention. For students with disabilities, selecting annual goals occurs as a part of the IEP. Annual goals need to include specific skills or behaviors as well as measureable criteria for success. A vague outcome, such as "reading will improve," is insufficient because it could be interpreted many different ways. It could mean reading orally with fewer errors, reading at a faster pace, or reading by grouping phrases more fluently. The annual goal from this sample intervention plan tells us exactly what is expected of Norah, a struggling reader: We expect Norah to "read 2nd-grade-level passages at 80 words per minute with no more than one uncorrected error per minute."
Short-term objectives look much like the annual goal, except the criteria are meant to be achieved within 9–12 weeks. These objectives provide teachers with clear criteria for judging whether a student is on track to meet the annual goal at the end of each reporting period. Progress monitoring is thus streamlined within existing report card periods. In Norah's example, if she has met her objective in the 9–12 week time frame, it is clear to everyone on the team that she is on track to meet the annual goal.
Feature 2: Clearly Defined Intervention
After defining the outcomes, the team must determine what strategies to put in place to meet those outcomes. The federal No Child Left Behind legislation calls for the use of research-based practices in intervening with struggling learners. Also, to maximize the effect of any intervention, users must implement it with fidelity (Kutash, Duchnowski, & Lynn, 2009)—that is, they must implement the intervention the same way each time.
Selecting the specific intervention approach requires addressing several questions: What are the student's interests? When is the student most likely to demonstrate the skill in question? When is a given behavior a problem? How does the intervention mesh with various parts of the curriculum? No single individual designs the final plan. Rather, the plan reflects the expertise and ideas of all team members; these include teachers, specialists, and administrators as well as families.
In Norah's case, team members are taking a direct instruction approach (Engelmann, 1999). In the intervention plan, they provide additional details about how teachers will use that approach across both the general education classroom and the resource room. (See the Strategies section in the center of the form.) Recording the details is key not only to ensuring fidelity but also to understanding what might have caused or delayed a student's progress (Kutash, Duchnowski, & Lynn, 2009).
Feature 3: Data Collection System
After establishing outcomes and planning the intervention, the team determines a data collection system for ongoing progress monitoring. Because data should drive decisions in this process, progress monitoring is among the most crucial components of successful intervention (Stecker, Fuchs, & Fuchs, 2008). Developing the data collection system involves decisions about when to collect progress data and which rubric to use. (See the section on the right of the form titled Add New Progress Record.)
Data collection times. For most objectives, team members should select data collection times that fit naturally within the school day and blend well with the general education teacher's instructional schedule. In Norah's example, teachers selected two settings for data collection: (A) the in-class reading group and (B) the resource room. (See the section on the left of the form titled Data Collection Times.)
Data collection times might extend over four different subject periods, such as science, history, math, and language arts. Selecting data collection times across subjects may be useful when teams want to ensure that students demonstrate a skill, such as writing, across the curriculum.
Teachers don't need to collect data every day or in every selected setting. As the sample plan shows, blank sections occur. Nevertheless, teachers must collect enough data to show progress over time.
Progress rubric. A progress rubric must not only describe progress but also measure it. The sample intervention plan form includes four color-coded levels of performance. (See the section on the left of the form titled Progress Rubric.) Level 1 (red) corresponds with the student's level of performance at the beginning of this intervention, whereas Level 4 (green) includes the criteria to meet the short-term—not the annual—objective. Norah is reading at 45 words per minute at the start of this intervention, so this becomes Level 1 on her plan. Her nine-week objective is to read at 60 words per minute, which becomes the Level 4 criterion. The team chose two intermediate criteria for Levels 2 and 3.
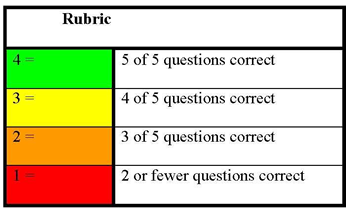
Other objectives may not lend themselves so easily to a rubric as rate of reading. For example, reading comprehension will require the team to consider what to measure and how to measure it. Let's say that a student, Spencer, is currently able to answer only one of five comprehension questions about a grade-level reading passage. This might be the objective for that student: "After reading a 200–300 word grade-level reading passage, Spencer will correctly answer five comprehension questions about the story." The rubric for this objective might look like the one in Figure 2.
Figure 2. Comprehension Progress Rubric
If a student has not made adequate progress toward an objective, the team needs to have a conversation to decide what to do. The visual format of the intervention form enables team members to quickly review the data and make decisions about the intervention.
Feature 4: Visual Representation of Data
Teachers and families need detailed information on students' progress that they can easily understand and interpret. Charts and graphs serve this purpose well (Schmid, 1954). In addition, visual representation enables educators to share information with families that have limited literacy skills or speak languages other than English.
Historically, line graphs have been used to visually represent progress data. An alternate method of visual representation is simply to color code the data collection sheet, as shown in Norah's example. The progress record clearly illustrates Norah's progress toward her objective. Because it also separates the settings (the in-class reading group and the resource room), it's easy to see where Norah made the quickest progress. At the end of the reporting period, the team can add a narrative explanation and give this progress record to the student's family.
Feature 5: Web-Based Platform
In our earlier work, we found that when teams used the intervention plan on paper, collaboration in intervention design and data gathering was rare. This is partly because a paper form can only exist in one physical location.
This fifth feature—a web-based platform—ensures that the intervention planning process is practical and that educators can use it to scale. Much like a wiki, the online format enables multiple team members to access and contribute to the most current version of the plan without any extra coordination efforts.
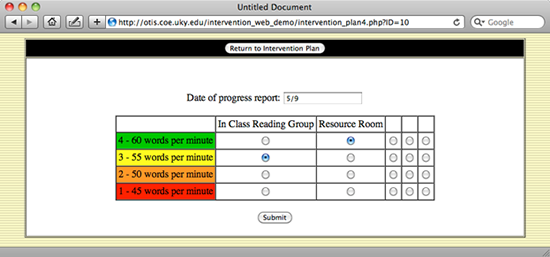
The web-based format also improves the efficiency of visually representing progress. Any team member can click on a button to add to a progress record; they simply enter the date and record the new data point. (Figure 3 shows the screen prompt.) Data are automatically color coded and added to the display. Further, because the data are part of a larger database, schools can visually examine trends in the data over time by student, classroom, or team member.
Figure 3. Screen Shot of Prompt for Adding a Progress Record.
Our work with schools indicates that teams find the web-based intervention plan easy to use, easy to manage, and extremely valuable. Others have found that students in classrooms using technology-based progress monitoring outperformed those in classrooms without this technology (Spicuzza et al., 2001; Ysseldyke, Spicuzza, Kosciolek, & Boys, 2003). Better and more efficient progress monitoring tools can lead to better instructional decision making and improved student outcomes.
The online format also opens exciting opportunities for including multimedia resources. For example, Norah's plan includes a short video—the one in the sample was taken from a public-use website—that anyone on the team can watch to see the intervention in action. This can be especially useful when several people in different settings are implementing the intervention. The video could also show a team member explaining an intervention or the student engaged in a specific intervention activity.
Other types of media could be included as well. For example, a physical or occupational therapist could include photos of a positioning or support strategy. Such multimedia resources help ensure fidelity of the intervention.
A Powerful Guide
It's difficult to find a practical and efficient intervention planning and progress monitoring system that includes all the necessary components. Our planning form can guide educators in their efforts to meet that challenge. It can have a powerful effect on the quality of intervention plans developed for individual students (Jung, 2010).
